This graph speaks volumes about the impact to society from…August 12, 20202020-08-12T22:21:57Z2020Current Events
This graph speaks volumes about the impact to society from…
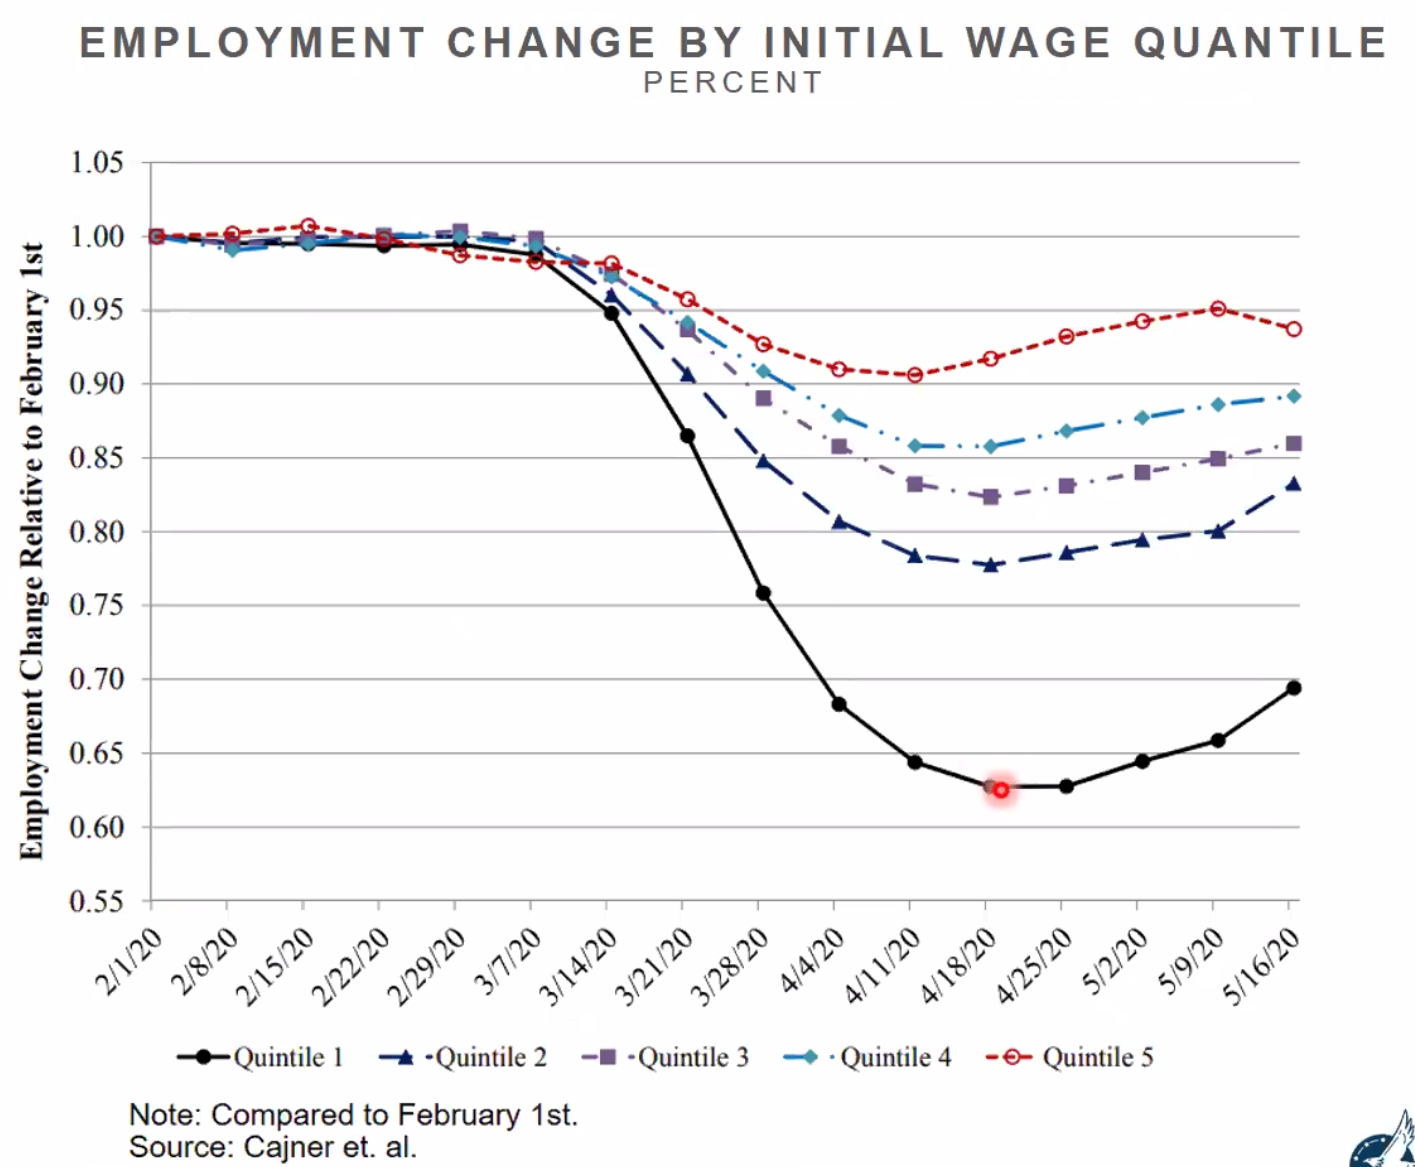
This graph speaks volumes about the impact to society from the pandemic.
Get the Weekly Thing
Every weekend I send a letter with the things I read and thought about during the week. It’s not a product. It’s a letter. I’d love it if you read along.