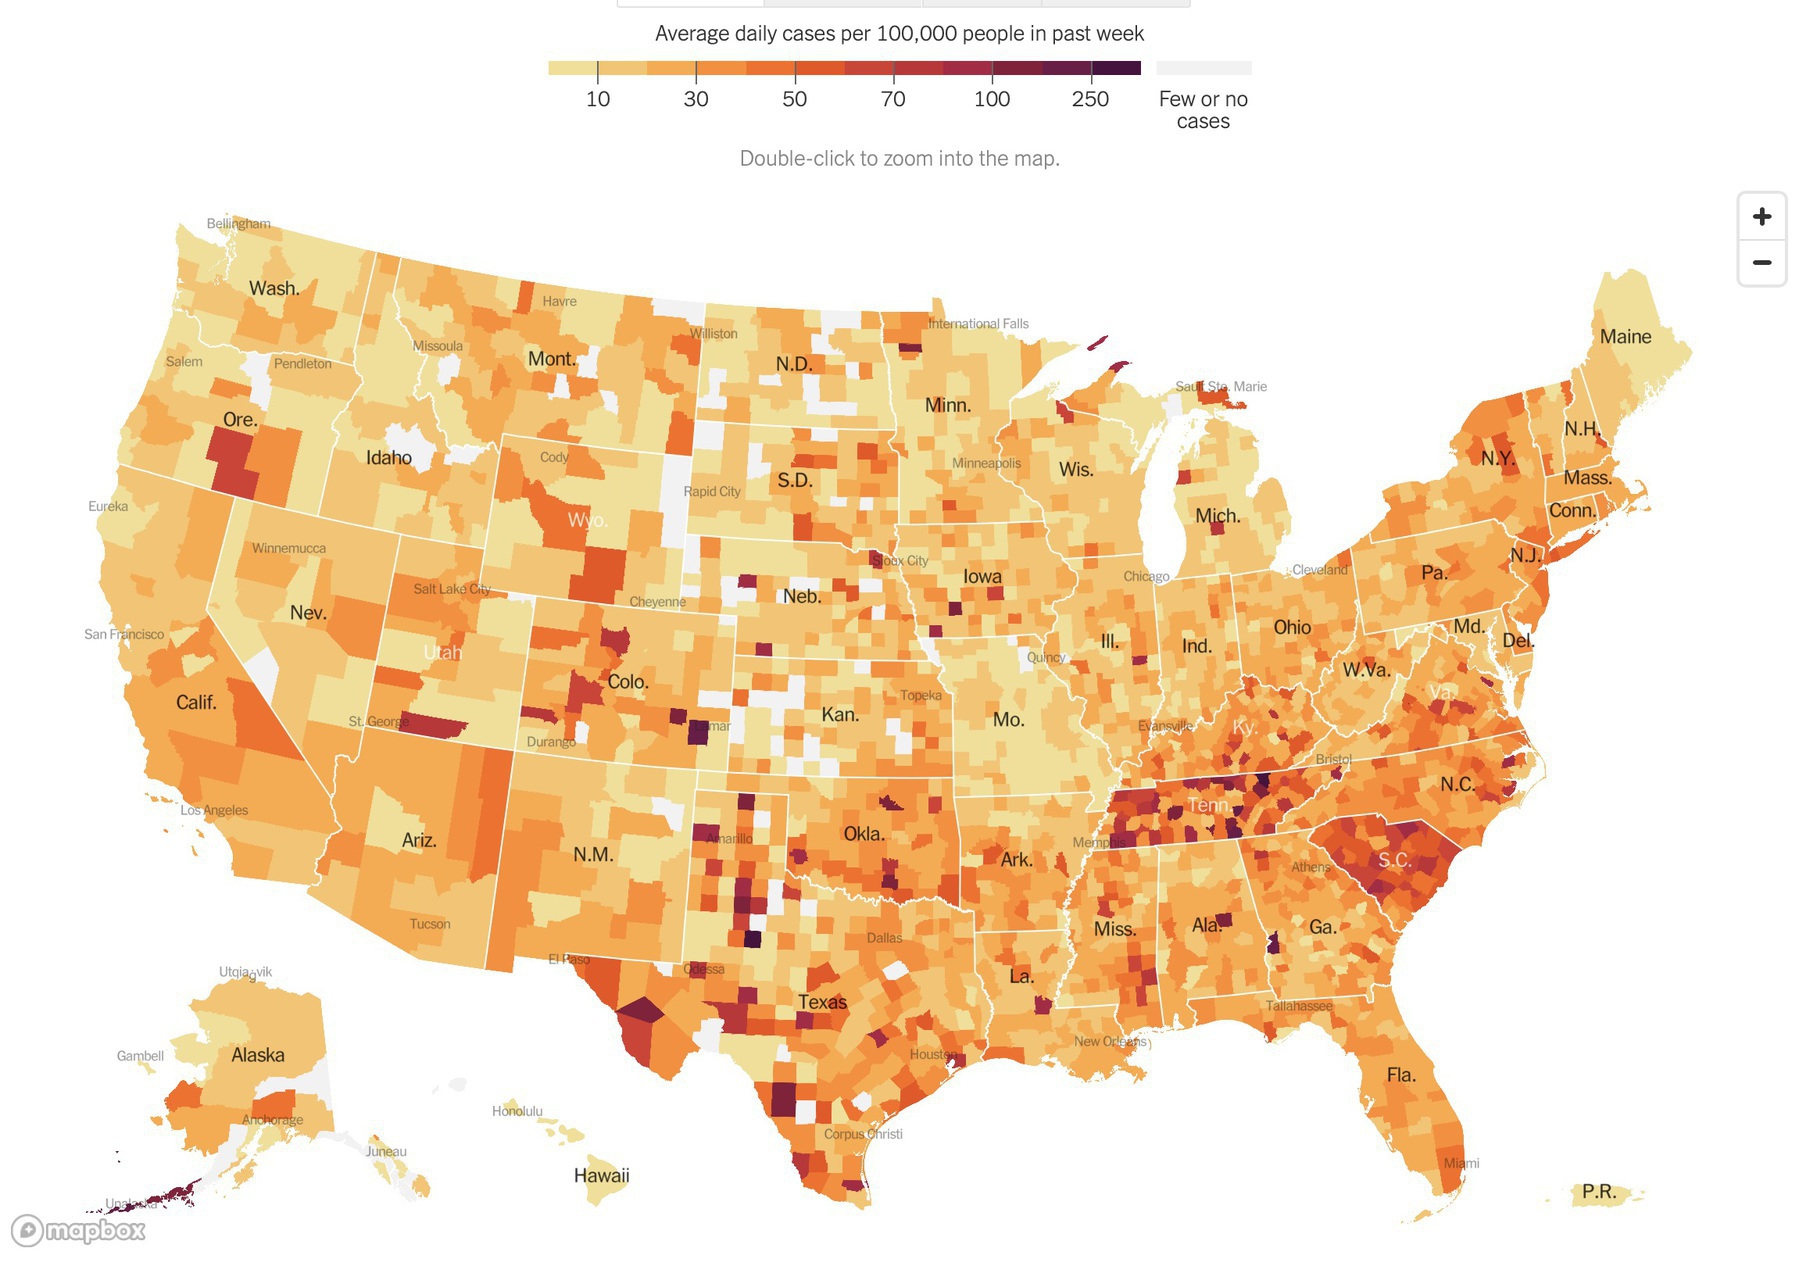
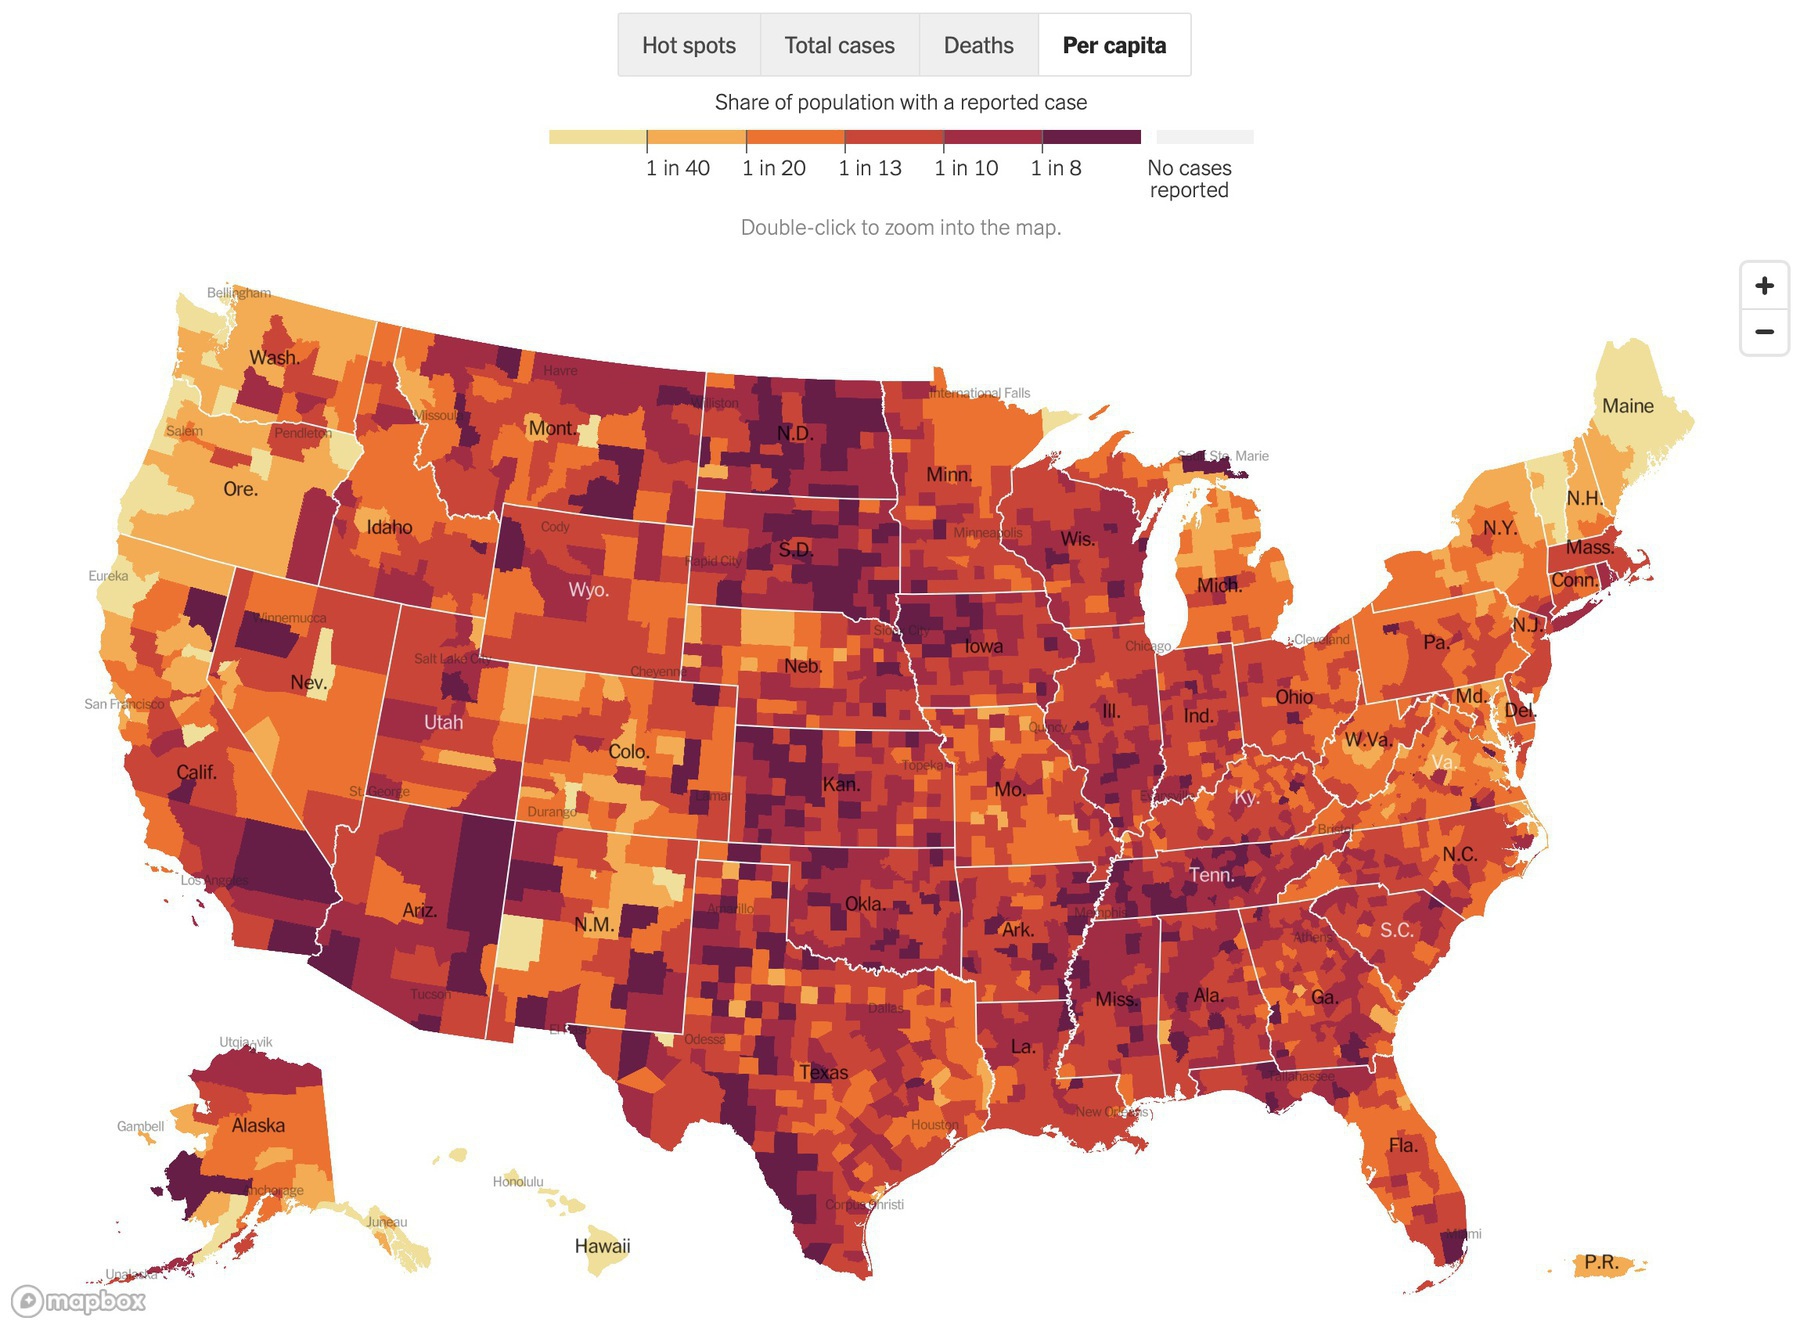
COVID-19 Maps on Feb 17, 2021 via New York Times.

Writer of the Weekly Thing. Blogger. Explorer of tech, the open web, AI, and a good escape room. Maybe a podcast? CTO of SPS Commerce, Board Member of MnTech, Former Board Member Minnestar. Minneapolis is home.
COVID-19 Maps on Feb 17, 2021 via New York Times.