
Go Dollar!
As we are preparing for our trip to London I started watching, with great displeasure, the demise of the US Dollar. However, August has brought some pleasant changes. (Note, this is a chart of how many £ GBP’s you can get for $1 USD. Higher is better for us.)
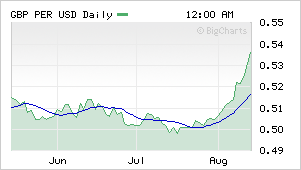
Seeing these recent moves I’m feeling that I picked a good day to wire the 2nd half of our apartment payment as well as the £1,000 security deposit. We are at the best point of the entire year.
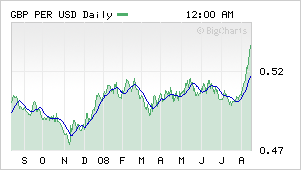
Charts are all from my alma mater BigCharts.com.