Jamie Thingelstad Profile Photo

Jamie Thingelstad

Writer of the Weekly Thing. Explorer of tech, the open web, AI, and a good escape room. Minneapolis is home.
  • About
  • Connect
  • Newsletter
  • Podcast
  • Lists
  • Collections
  • Projects
  • On This Day
  • Archive
  • Search
Jan 14, 2026 ∞

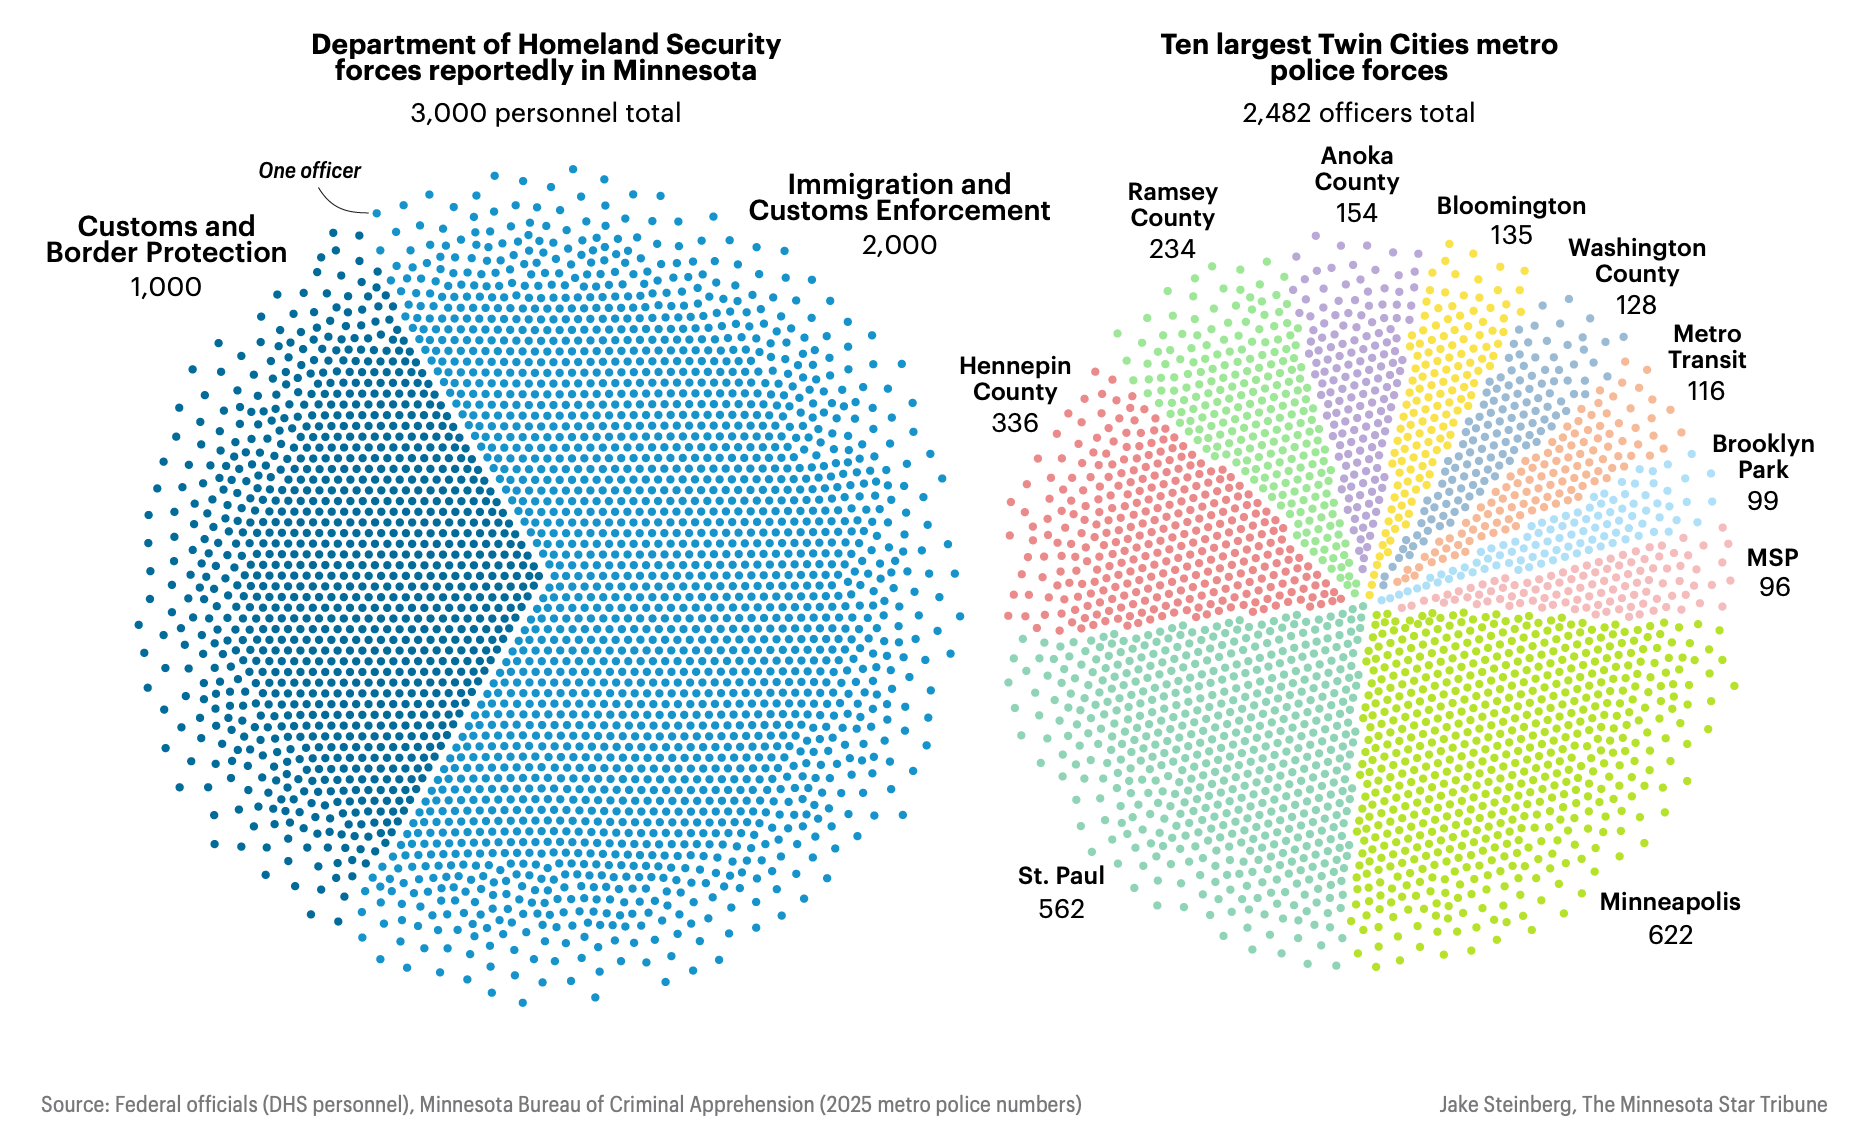
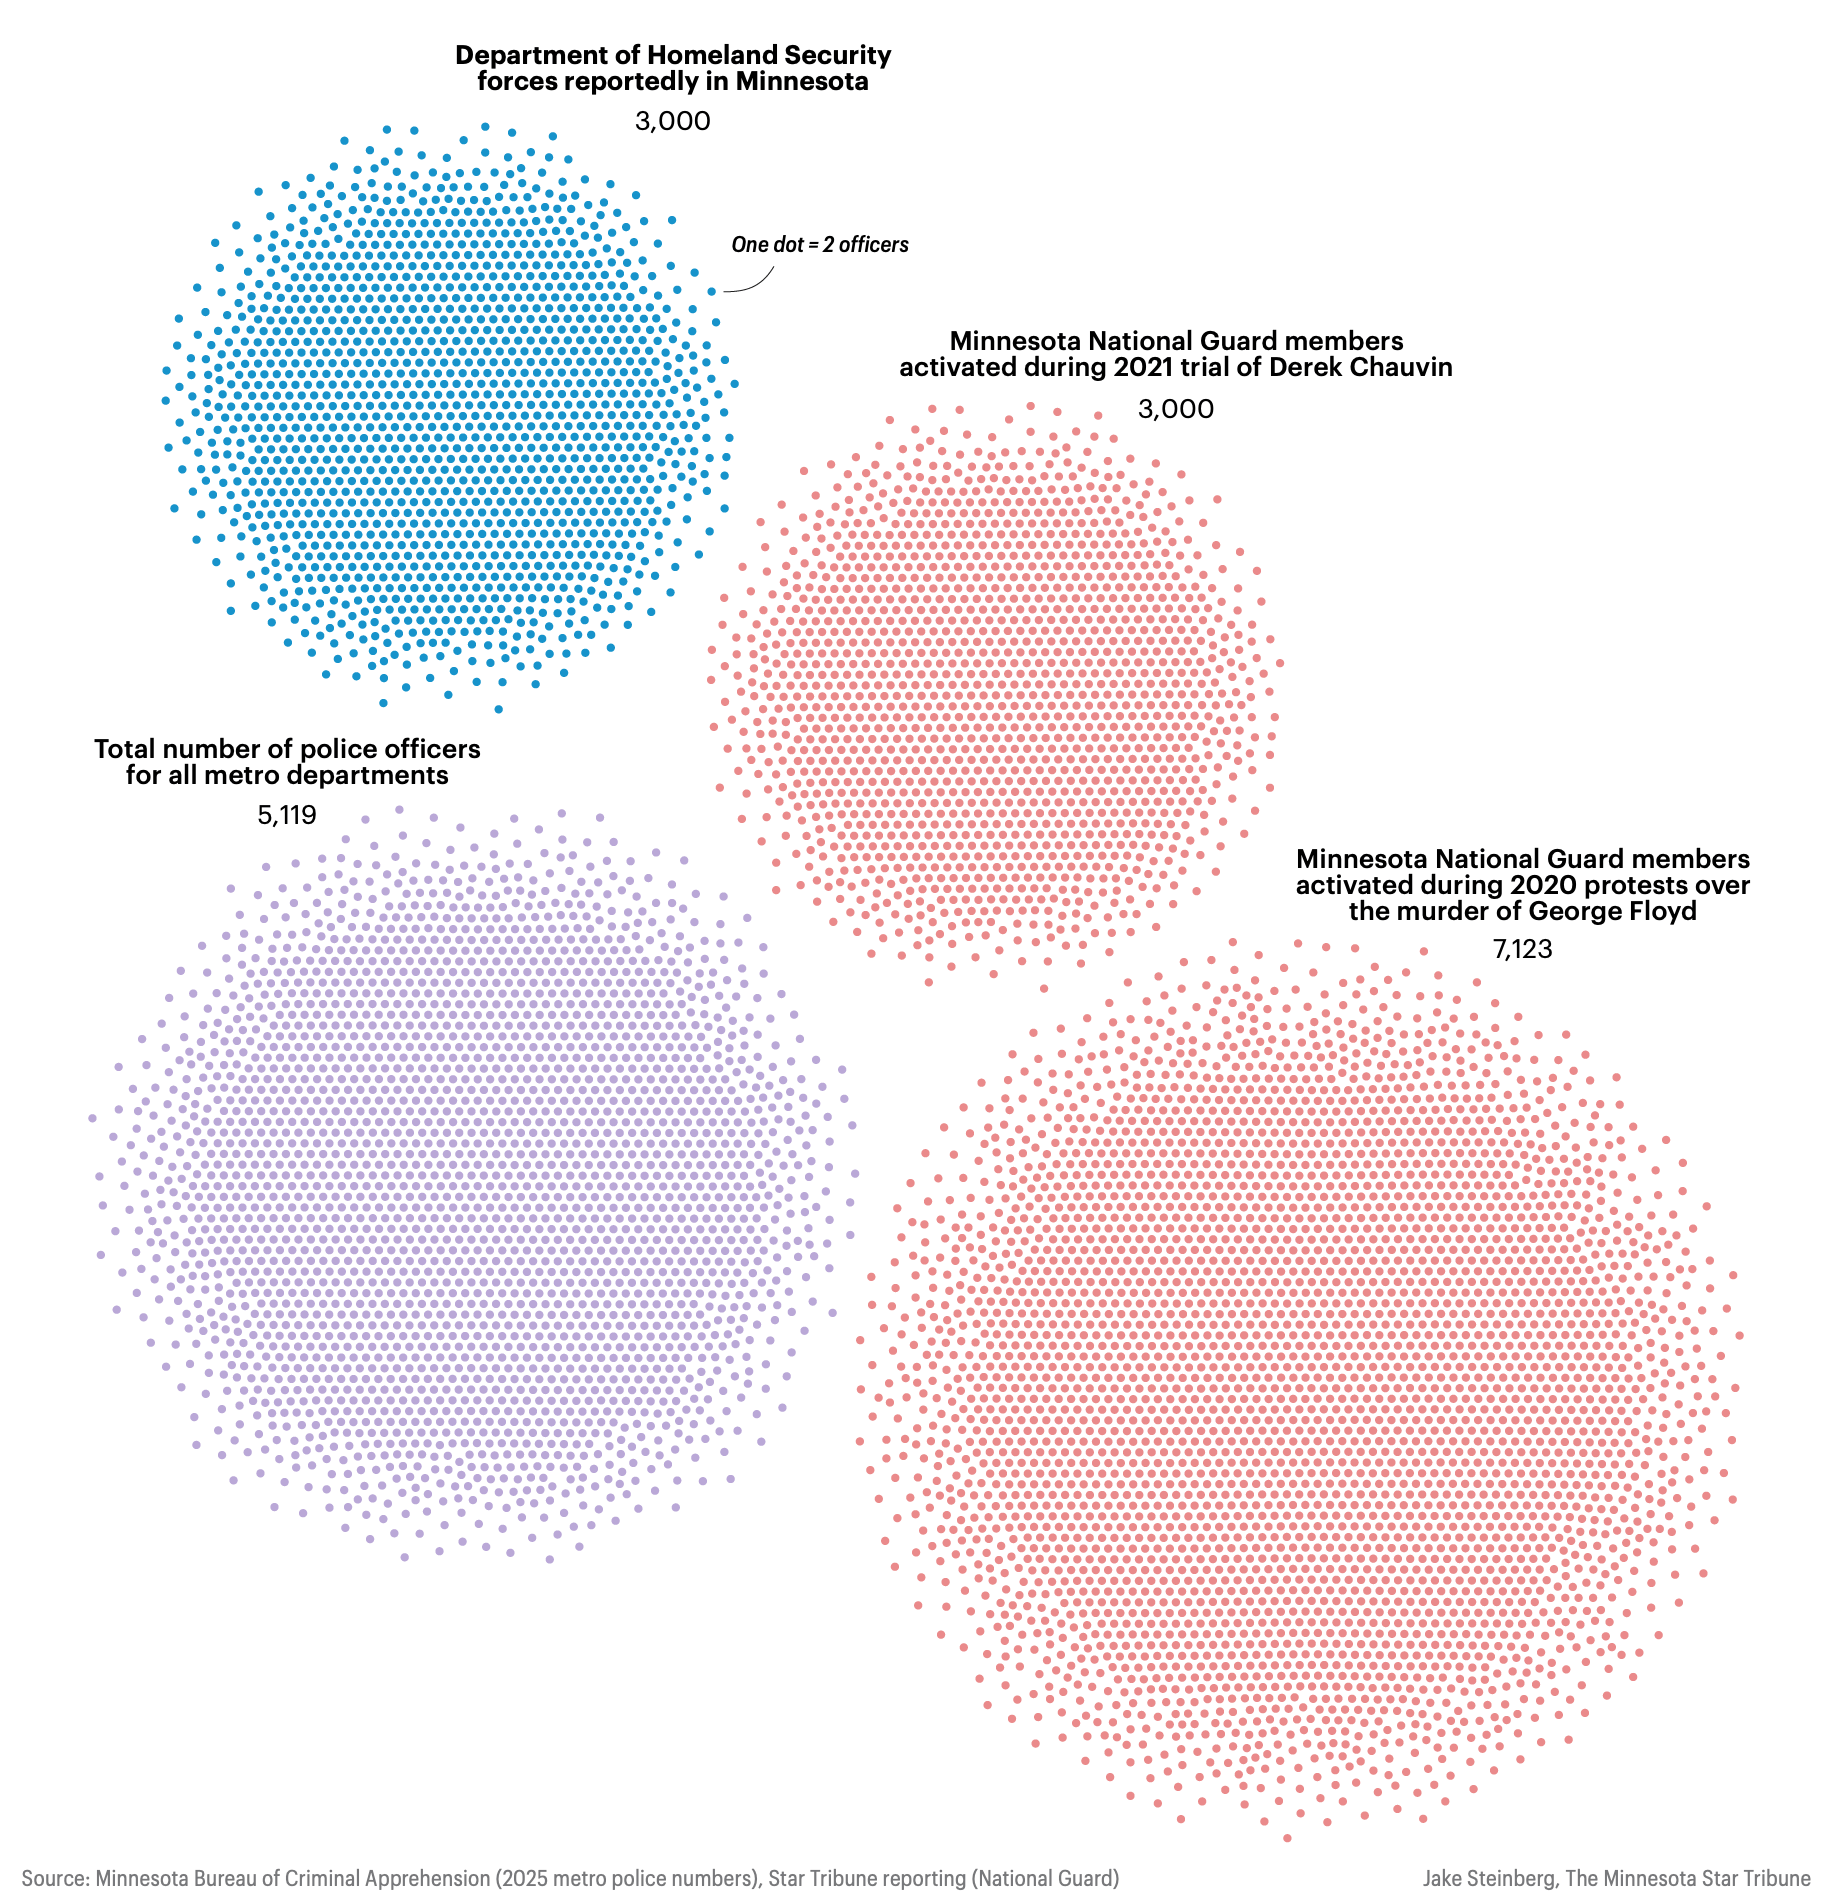
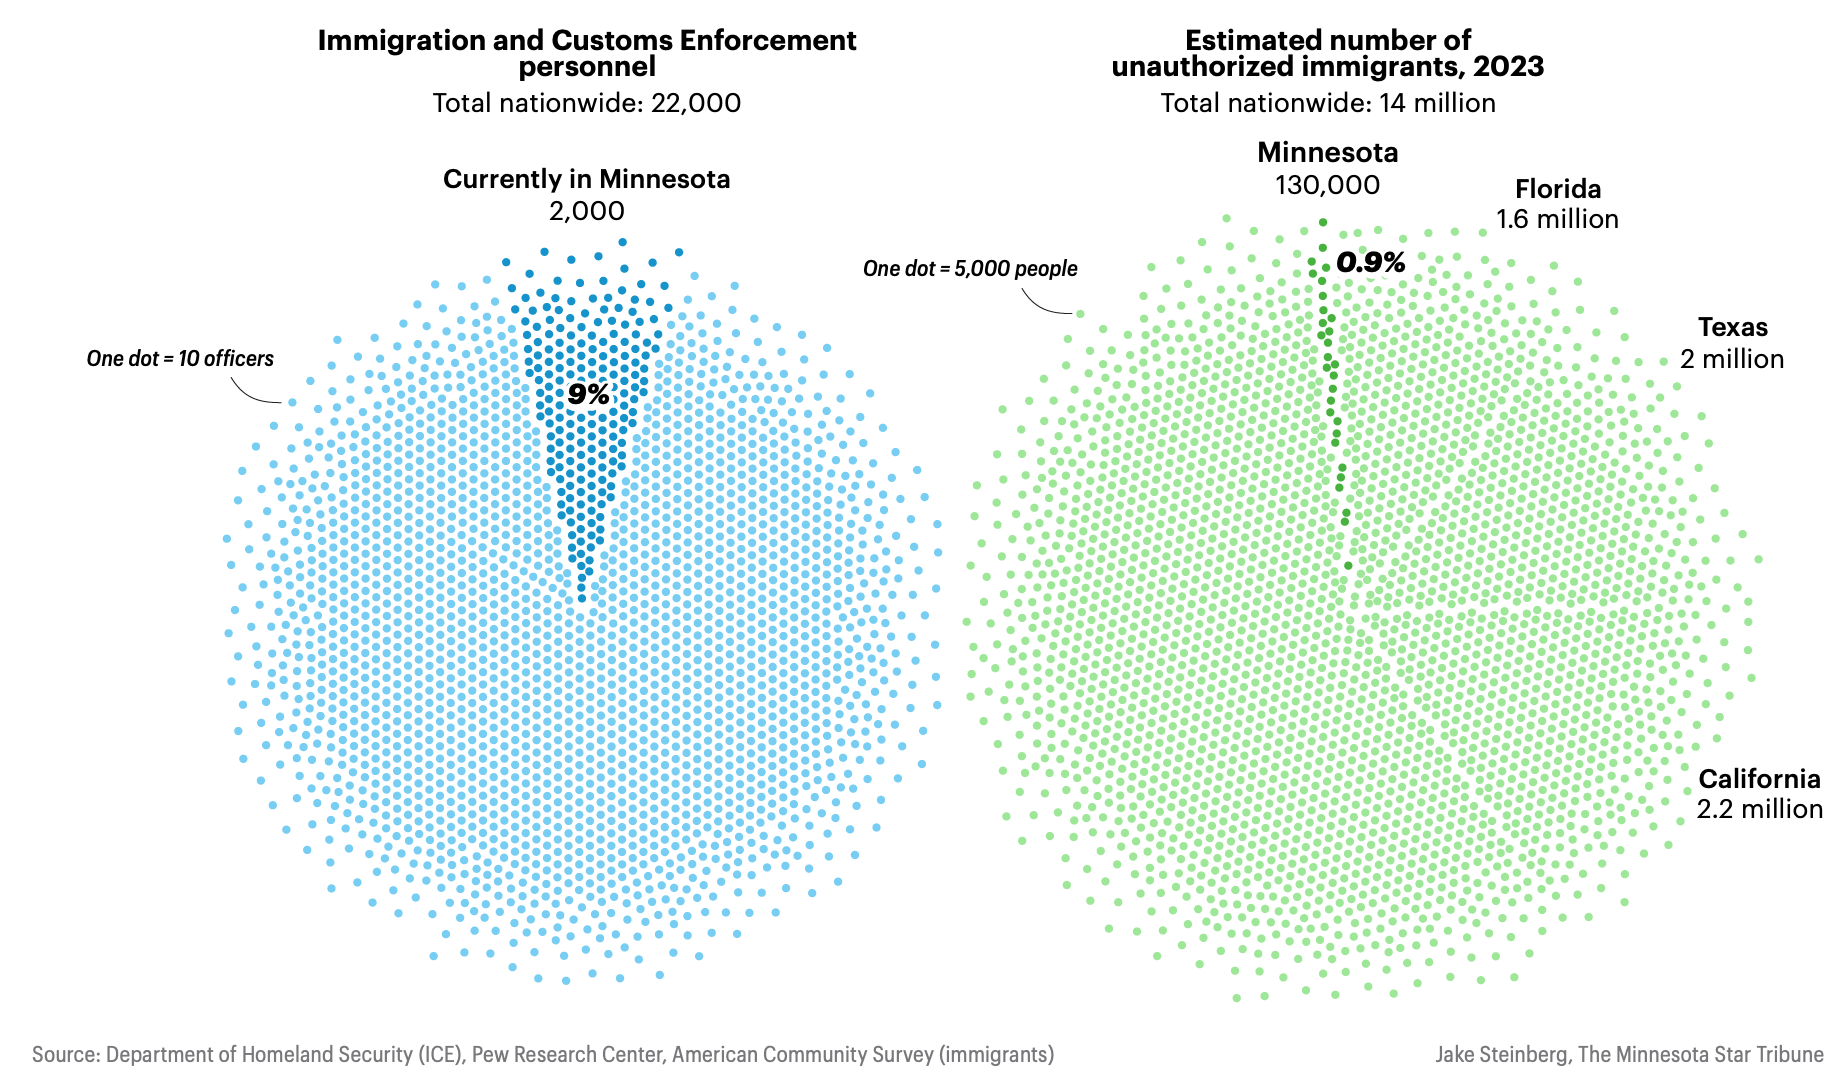
Good data visualizations showing ICE presence versus police in Twin Cities area.

Auto-generated description: Two pie charts compare the number of Department of Homeland Security personnel in Minnesota with police forces in the ten largest Twin Cities metro areas. Auto-generated description: A series of colored dot clusters visually represents various groups. Auto-generated description: Two circle charts compare the number of Immigration and Customs Enforcement personnel to the estimated number of unauthorized immigrants in 2023 across the U.S.
  • ✍️ Reply by email

This work by Jamie Thingelstad is licensed under CC BY-SA 4.0
Your privacy is respected without ads or tracking.
The opinions expressed here are my own and not endorsed by any affiliated entities.
No content aims to harm anyone or anything.

Jamie Thingelstad 👨‍💻 weekly.thingelstad.com

Technologist, leader, and family man with expertise in software, architecture, business, who actively contributes to the tech community.

Hosted by Micro.blog. Powered by Tiny Theme. Designed with ♥ by Matt Langford.