
2017 in Meetings
Manager and maker schedules is a relatively popular topic. The basic thesis is that maker schedules need to consist of large blocks of dedicated time on a goal. You need time to connect with the work, hopefully, achieve some period of flow and realize an objective. Manager schedule, however, is divided up into small segments of time to connect with people and topics, get information and make decisions.
In my position, I operate on manager time with occasional injections of maker time. I am deliberate about how I manage this. My objectives and goals are realized, in part, through my calendar. In recent years I felt I could better align my calendar and time with my objectives, so in 2016 I did an end-of-year one-time analysis of my calendar and made some changes. After reviewing that analysis, I decided the benefit was valuable enough that in 2017 I committed to collecting more granular data. My goal is to determine alignment and effectiveness of my schedule to my objectives. I developed a set of workflows that I run at the end of every day to collect this data.
Now that I’ve collected a full year I can look at an overall budget to actual analysis. In business, we always look at our financial budget and compare to actual. In managing my time, I find it helpful to consider a budget and measure the actuals as well. You cannot budget well if you don’t collect actuals.
I’m going to share some of the statistical information that I gathered while doing this in 2017. I’m not sharing any information about the content or context. You may consider this navel-gazing, but some may find it interesting, and perhaps it will encourage others to be more deliberate about managing their time.
This analysis refers to meetings on my calendar. These are meetings involving other people. I block time on my calendar for solo work, and that is excluded in this analysis.
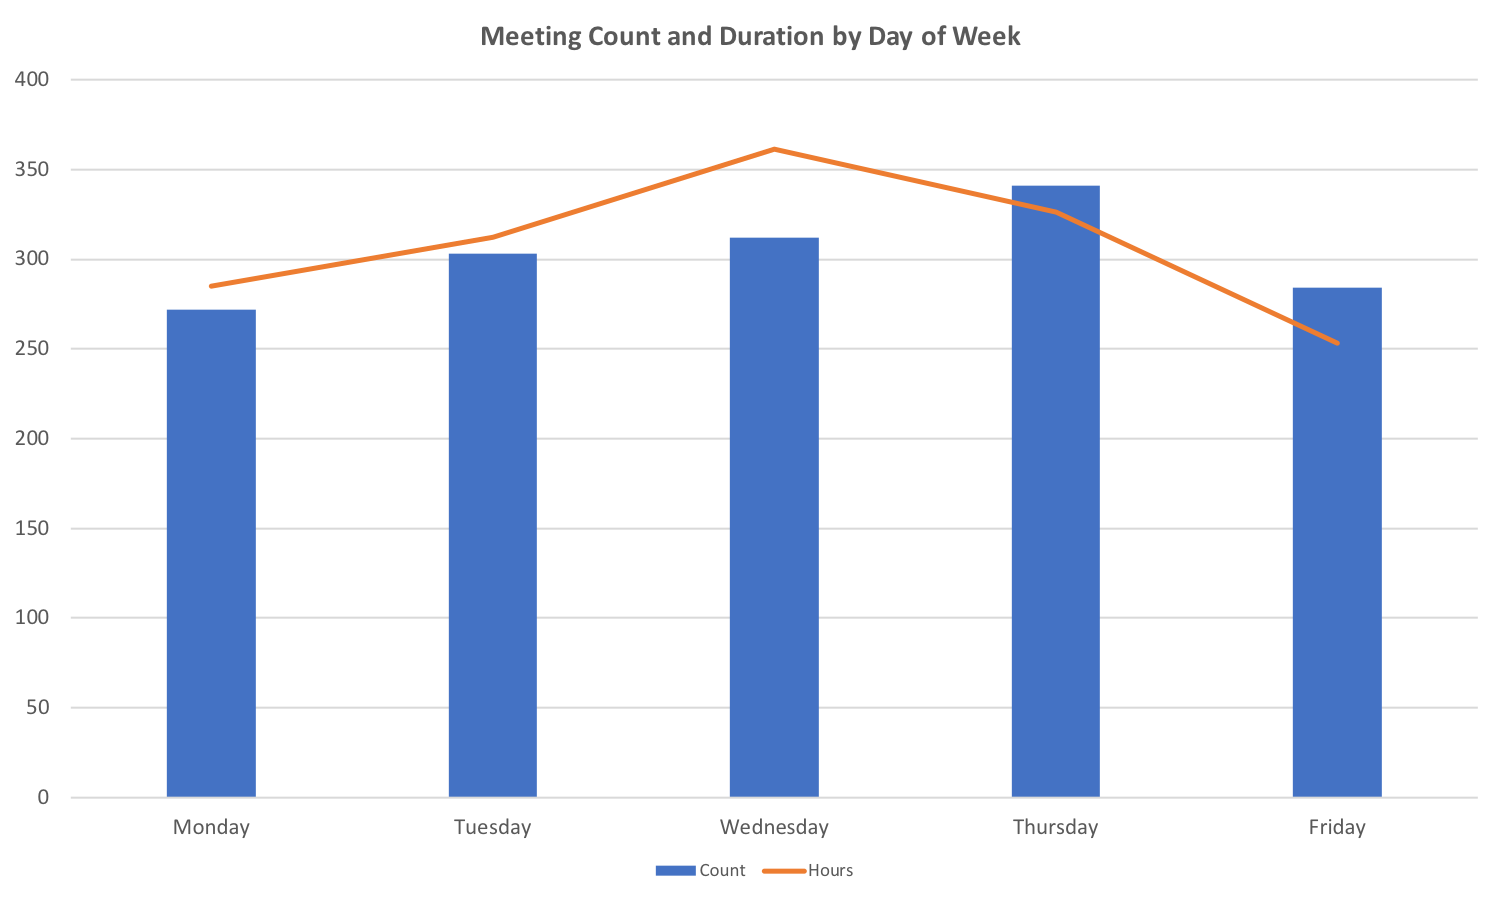
In 2017 I had a total of 1,512 meetings. These meetings occurred over 223 days. That is an average of 6.8 meetings per day.
Meeting frequency is highest on Thursday. However, the largest cumulative hours are on Wednesday. Friday has shorter meetings on average. I would have thought that meeting count would spike on Tuesday and then trend down through the week.
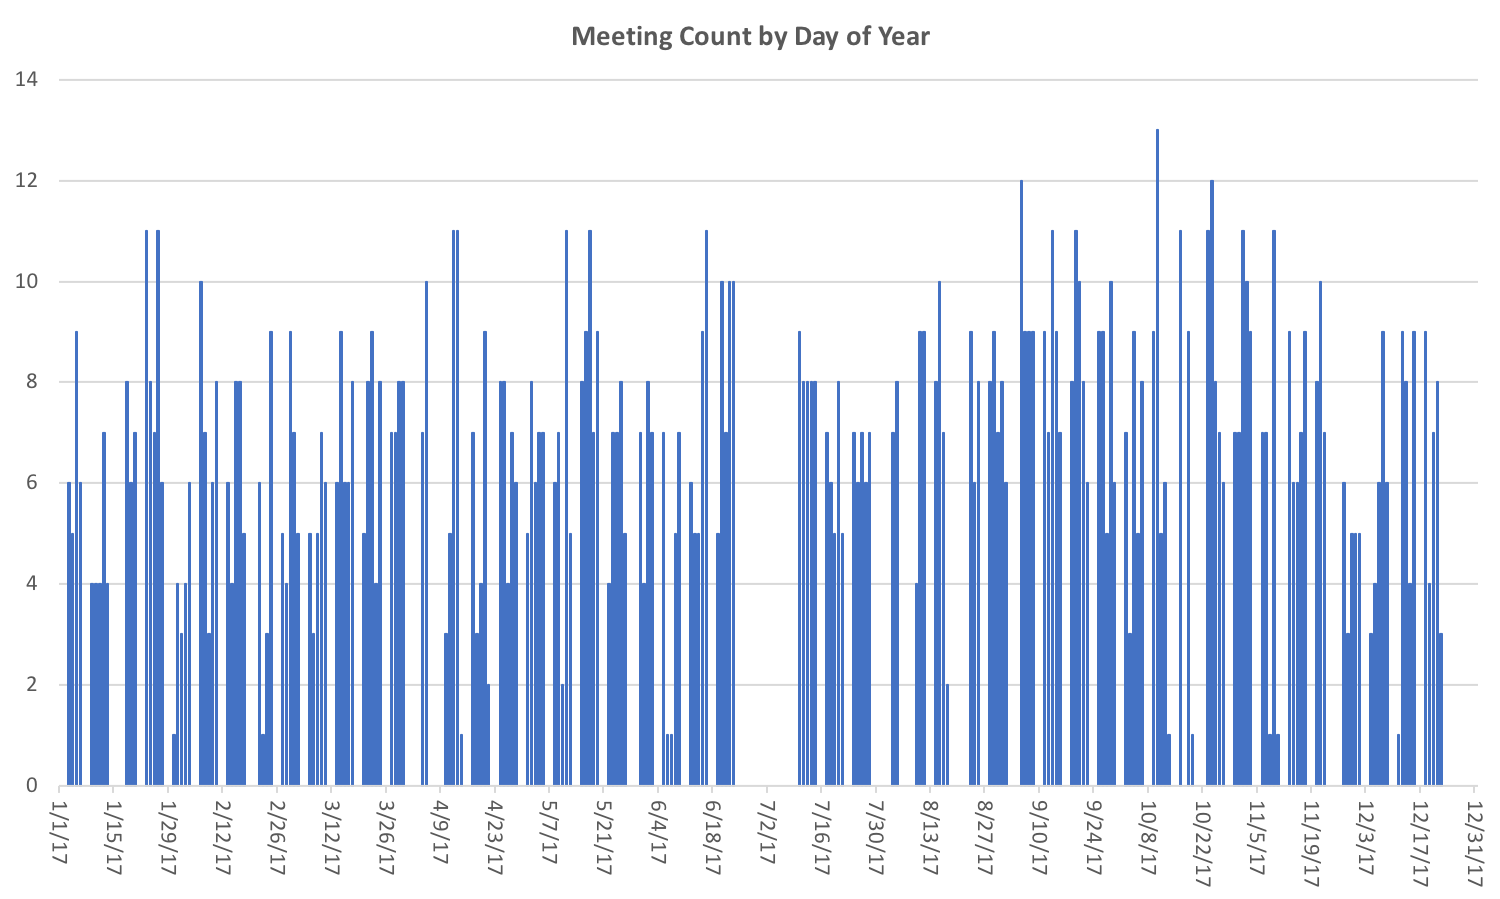
Let’s look at how these meetings occur over the course of the year. The average of 6.8 meetings per day shows visually here. There are many spikes, with one notable day having 13 meetings. Weekends are shown here, and you can see the 2-week vacation I took in the summer.
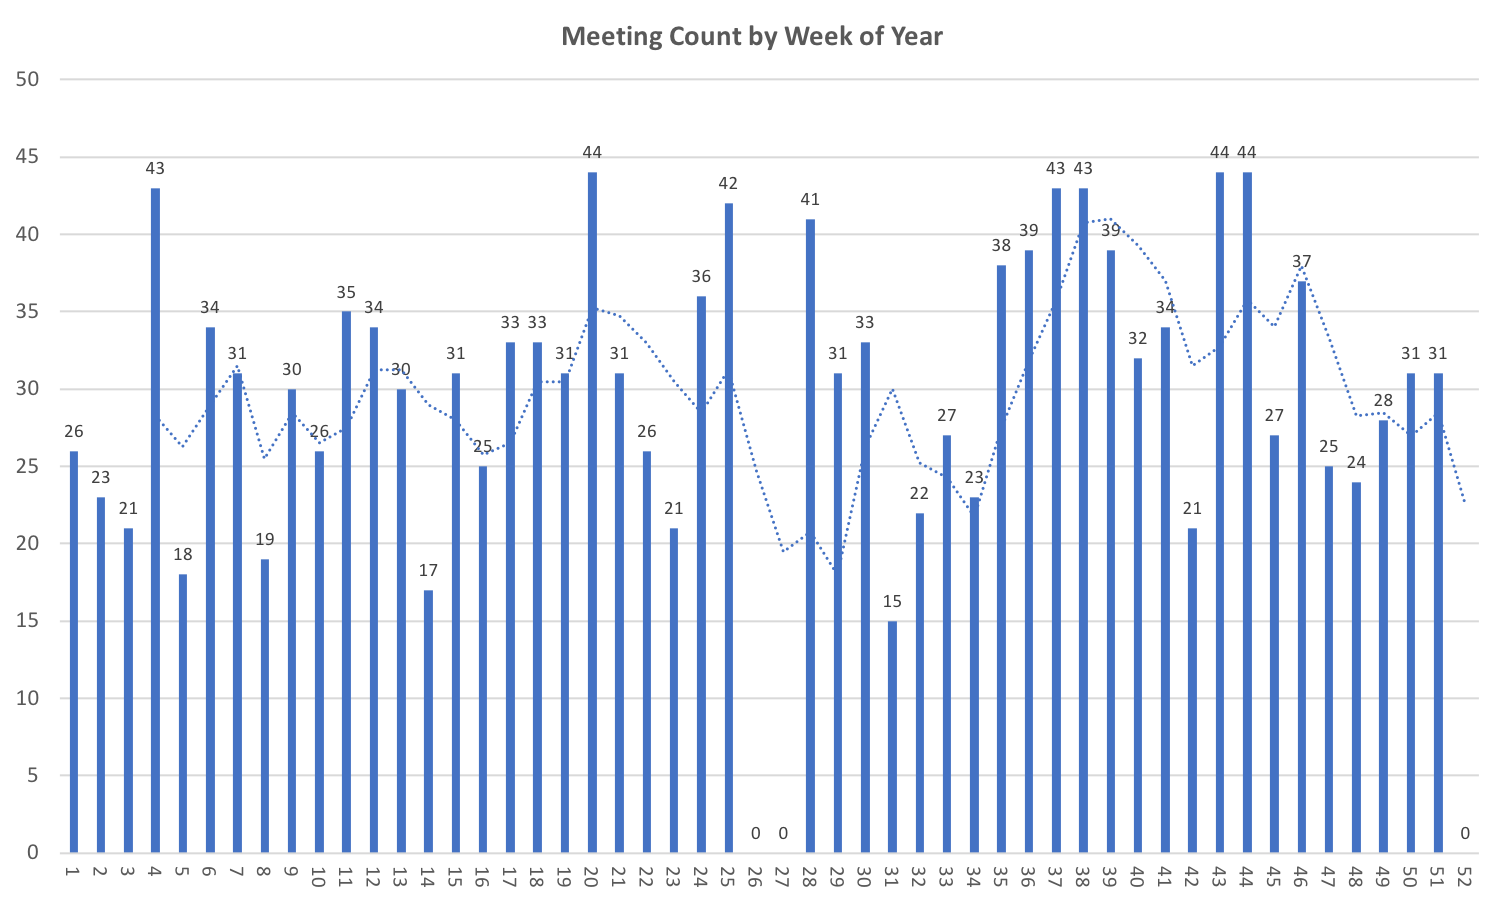
Daily data is noisy, and it’s easier to look at the 52 weeks of the year versus the working days. Here we look at the meeting count by week along with a 4-week moving average.
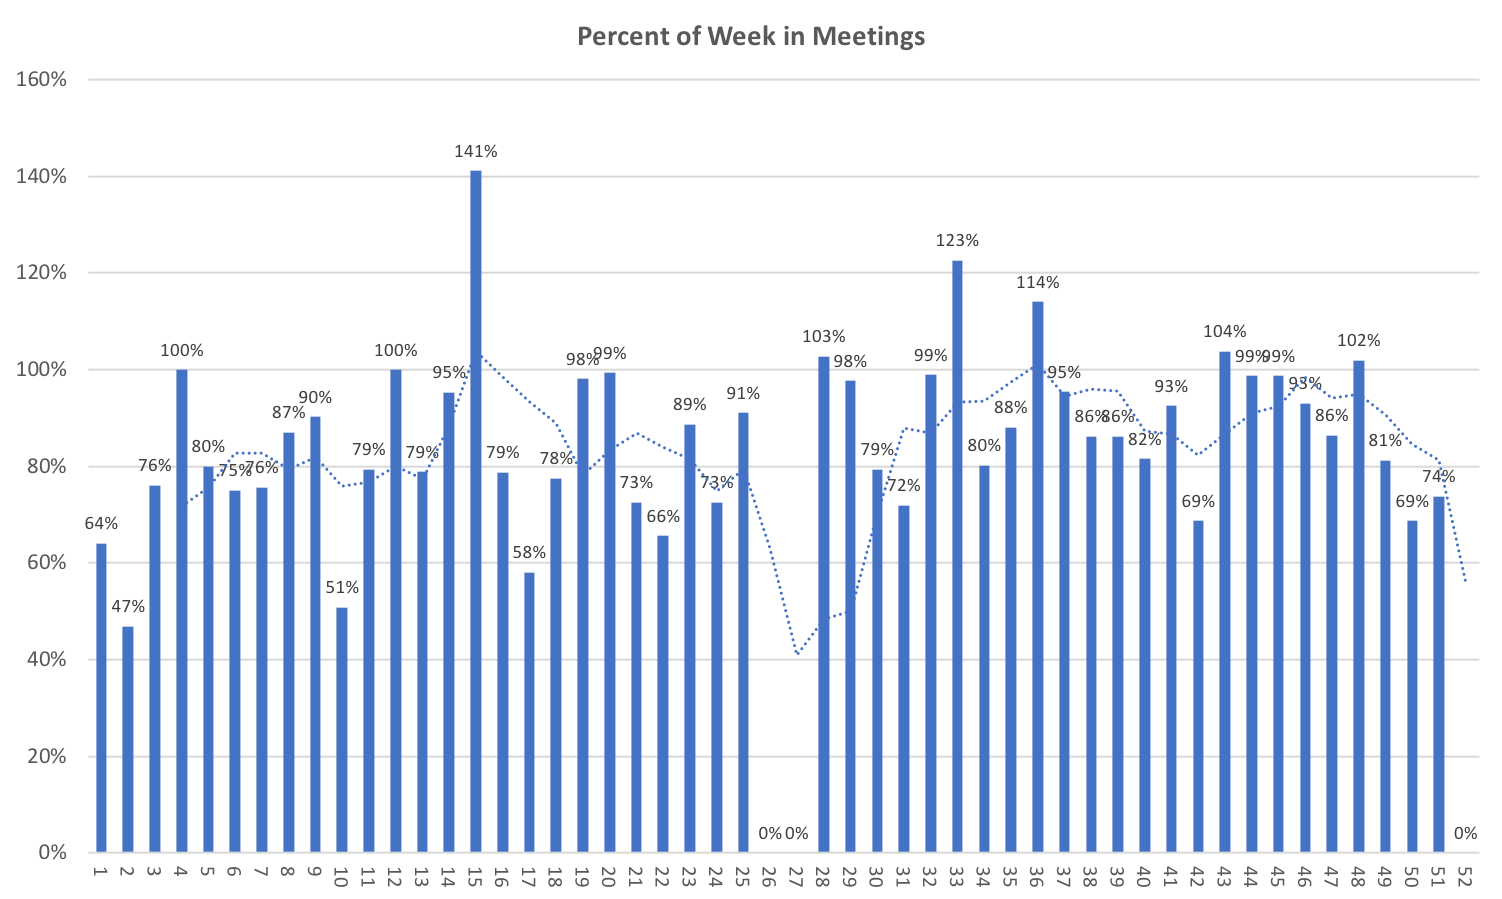
I got curious about how much of the week is scheduled in meetings. If we use an 8-hour day as a baseline then consider the load to be the percent of those 8 hours that were scheduled what would my weeks look like? It isn’t uncommon for me to have all of my time scheduled, and occasionally be over scheduled. As mentioned earlier, I do block time on my schedule for solo work activities. As a result, 81.3% is fully scheduled. Whenever I am over 81.3% I’ve removed that block to allow for more meeting time.
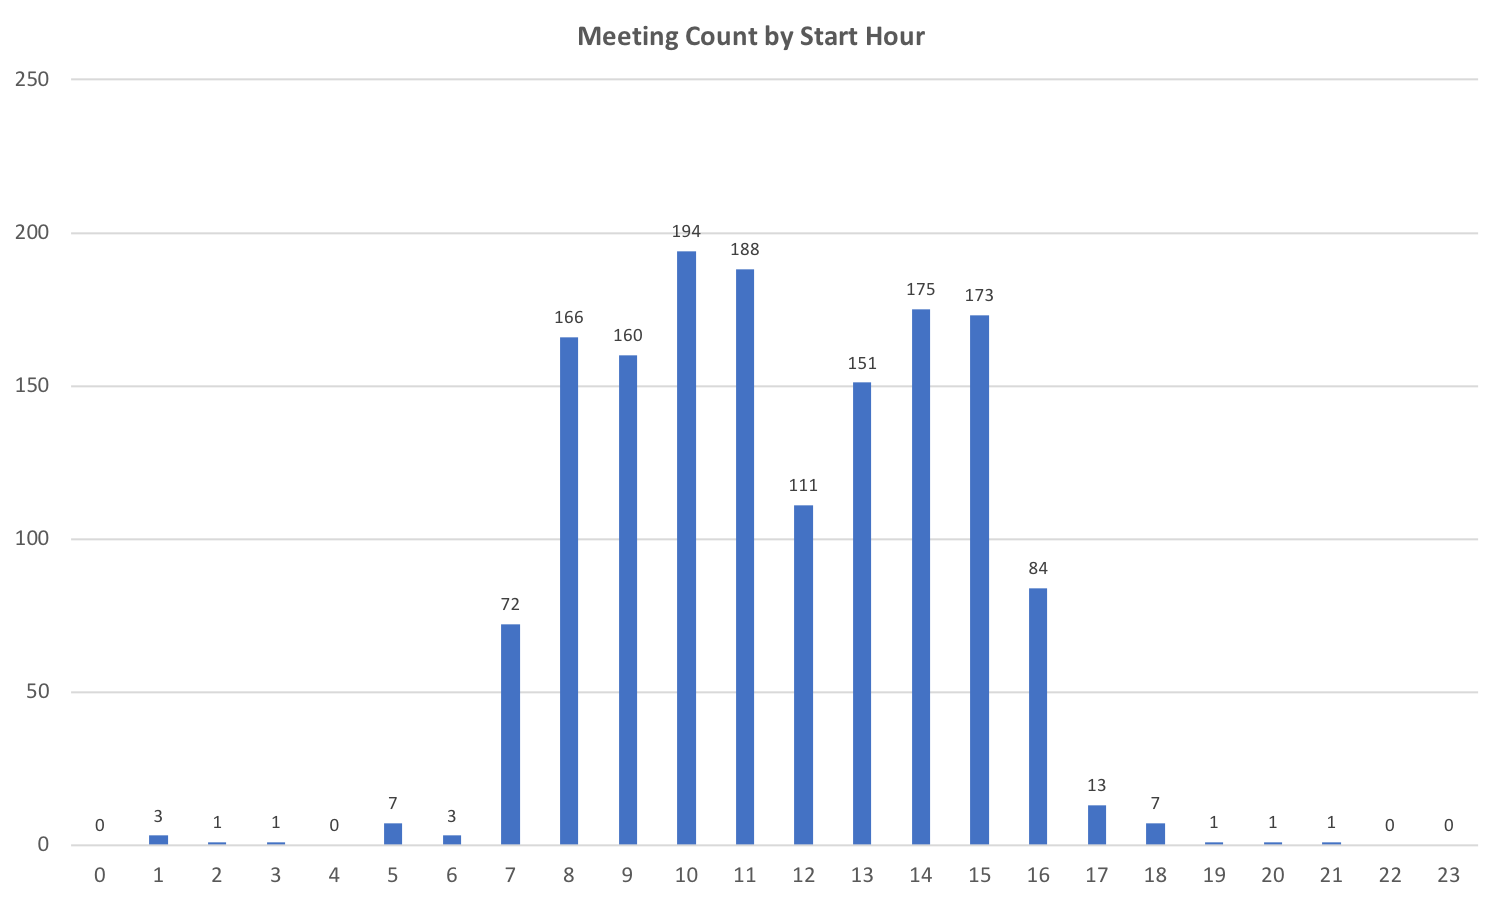
How about the start time, do more meetings start in the morning? I certainly feel like the morning is more frequently scheduled than the afternoons. Here is meeting frequency by start hour. My average day gets a fast start at 8 am with a dip at 12 pm. Most days I have meetings through lunch. There is a dip again at 4 pm. In our office, we are much more likely to start earlier than later, and you can see that with the frequency of 7 am meetings versus 5 pm. The meetings in the middle of the night were in Ukraine and are represented here in central time.
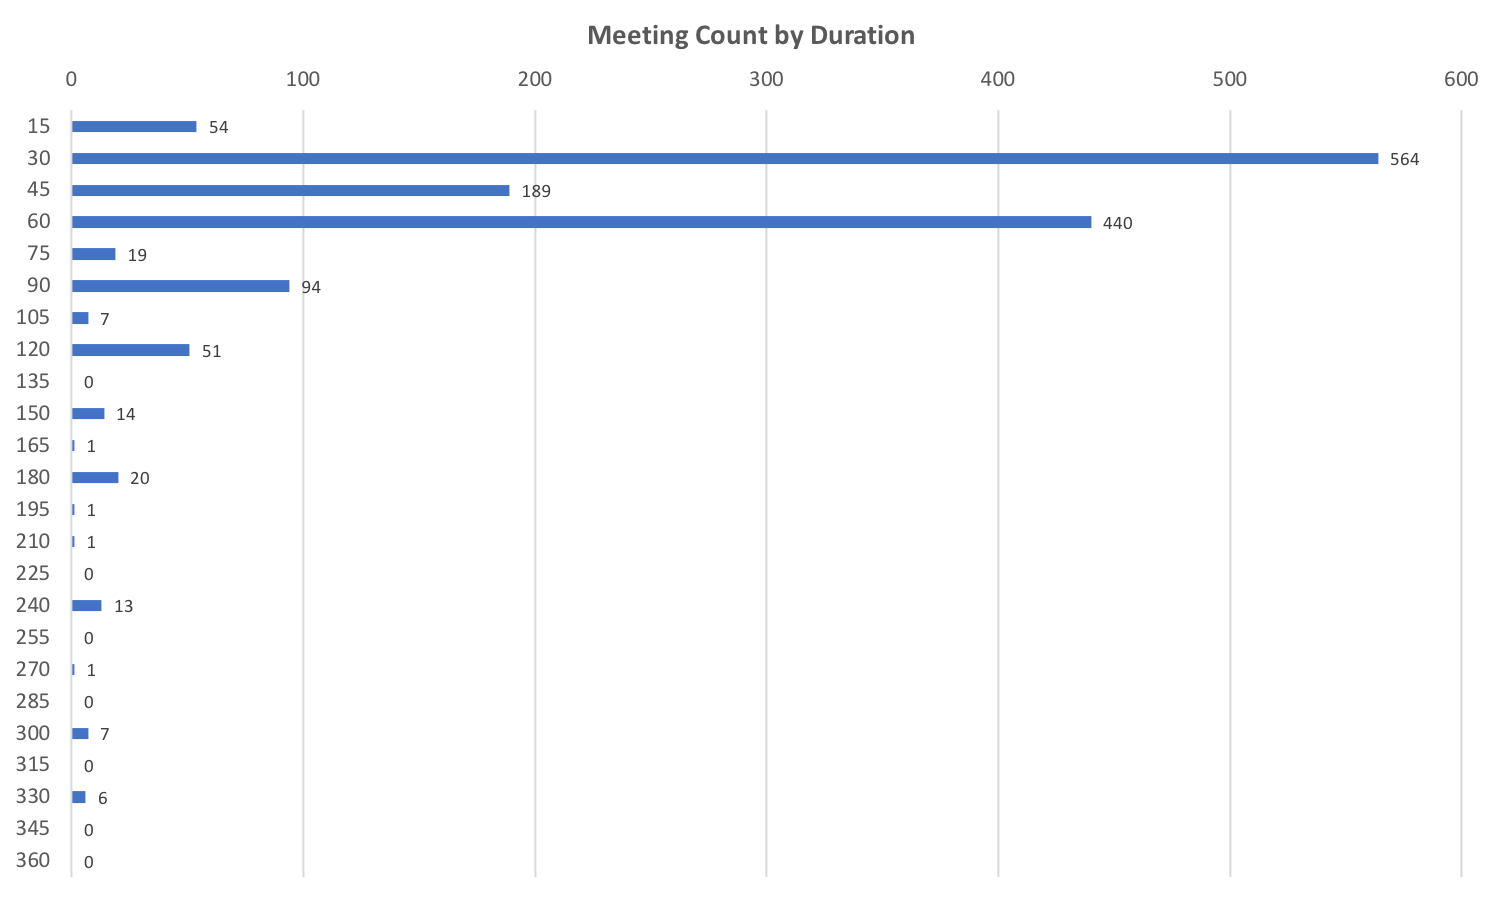
I was curious to know the distribution of durations. What duration of meetings do I have the most often? The most common meeting for me is 30 minutes (37.3%) and then 60 minutes (29.1%). 45-minute meetings are also common (12.5%), that is the normal time I schedule for 1-1 meetings with my team.
This statistical data is most likely to gauge overall stress level or demand for my time. I also get this data in a weekly report and it is a nice check on my qualitative assessment of the week. The additional data I collect about topic and context is very actionable. I can see areas where I’m over or under budget on time and can consider structural changes to my schedule to align better. I like this act as the shift forces me to delegate some topics more, disconnect from some things and give more time and focus to the areas that I specifically need to focus on for success.
I would highly encourage anyone that has more than 50% of their time scheduled to do a similar exercise. It will provide some insight both to how you are feeling and the results you are getting.