
Tracking Twitter Followers with Cacti
Two weeks ago I was one of the guests on Midmorning on Minnesota Public Radio for a show about Twitter. The result has been a lot of conversations lately about Twitter. I was intrigued to see how many people had started following me from the show and before you knew it I felt the absolute need to see Twitter follower graphs in my favorite graphing tool, Cacti. I did a quick search and was surprised to not find anyone doing this already.
As with anything Cacti-related there was a lot of trial and error to getting this working, and I’m positive smarter people than I can do this with much more elegance, but I got it working good enough for me and the output is pretty slick.
If you’d like to join me in graph-tastic, RRDtool, Twitter navel gazing here is how. And I do know there are services that do these graphs, but I don’t believe any of them do anything more than daily counts. This samples every 5 minutes.
I figured I’d do this in Ruby just to make the Perl lovers in the crowd uncomfortable. At first I tried to use the Twitter4R gem to get to the Twitter API but that had issues, mainly it couldn’t deal with paging in the Twitter API and thus just returned 100 followers. Instead, I went straight to the Twitter API and found a better call in the social graph functions that just returns the id’s of people you follow or follow you. Less data, lighter, and no paging! Yeah! Here is the incredibly simple code that we’ll use to get Cacti the data it wants. All the comments will make this easy to follow. 😊
require 'rubygems'
require 'open-uri'
require 'json'

def get_count(url)
    buffer = open(url, "UserAgent" => "Ruby-Wget").read
    result = JSON.parse(buffer)
    return result.length
end

def get_follower_count(user)
    url = '[twitter.com/followers...](http://twitter.com/followers/ids/') + user + '.json'
    return get_count(url)
end

def get_friend_count(user)
    url = '[twitter.com/friends/i...](http://twitter.com/friends/ids/') + user + '.json'
    return get_count(url)
end

followers = get_follower_count(ARGV[0])
friends = get_friend_count(ARGV[0])

puts "followers:#{followers} friends:#{friends}"
Note that all this does is output one line that looks like this:
followers:464 friends:117
Cacti uses a simple name:value format to parse output from shell scripts. This little bit of Ruby does have some Gem dependencies, mainly a JSON library to parse the mess we get back from the API calls into something that Ruby likes.
This script takes the username as a command line parameter. This is so you can multiple twitter accounts in Cacti. Not only can you gaze at your own navel, but you can gaze at your friends navels too!
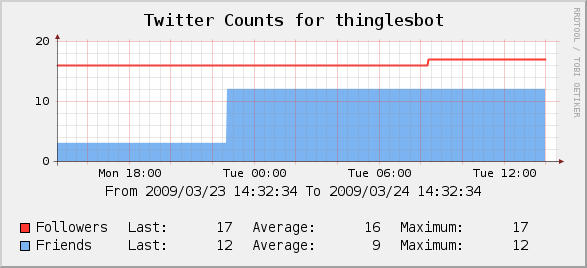
Let’s get to the point and show what the win is for this before we go through the Cacti configuration stuff. Here is the simple graph that we can use to track follower and friend counts over time.
I didn’t create Cacti templates for any of this, if you want to set it up yourself here are screen shots of the setup.
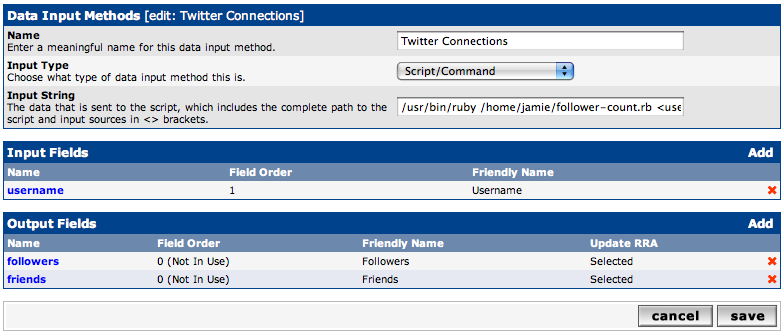
After you have put the follower-count.rb script somewhere and verified that it works from the command line you need to make a data input method in Cacti to get the data. Here is what that looks like (click on the image to enlarge). This is where you will pass in the Twitter username. If you want to track more than one Twitter account you just create another Data Input Method and pass a different username.
If you tried to track dozens or hundreds of users using this method I expect you will start hitting Twitter API request/hour limits. I currently track three accounts, which is 36 requests an hour. I haven’t hit any problems with that, but I would expect that if you were trying to track 100 accounts, and thus requesting 1,200 API calls, you would be denied.
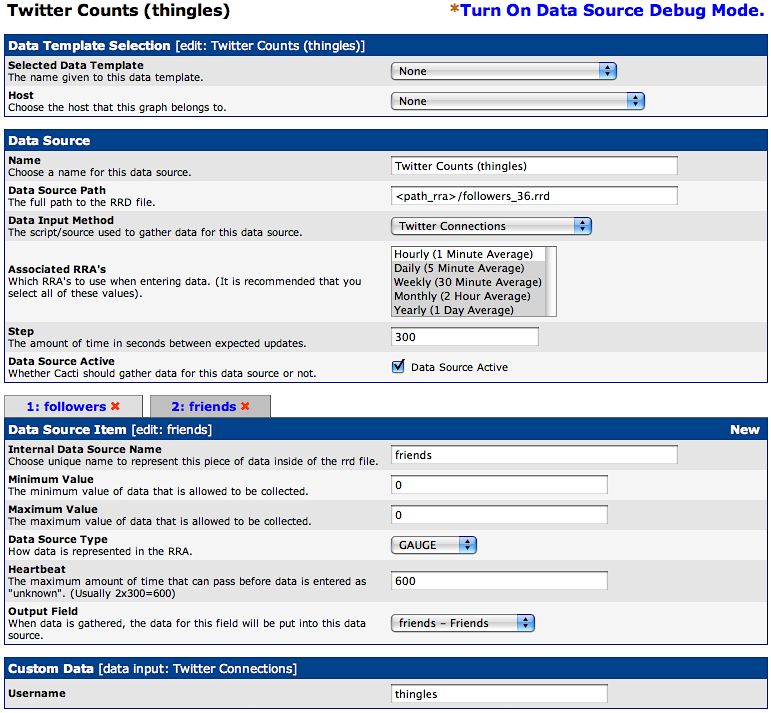
After you define the Data Input Method we need to create a Data Source. This one is the most tricky to get right. You need to make sure that you have the right RRA’s selected and it is very important to get both of the Data Source Items defined and mapped to the right Internal Data Source Name. Just make the screens look like this and it will be fine. It is very important that you do not have a Maximum Value defined. By default, Cacti will sometimes put 100 in there and cause the scripts return value to be ignored!
Remember that you will need to let a couple of poller intervals pass before the data is available for graphs to work. If you make the graphs right away expect some errors until data is available.
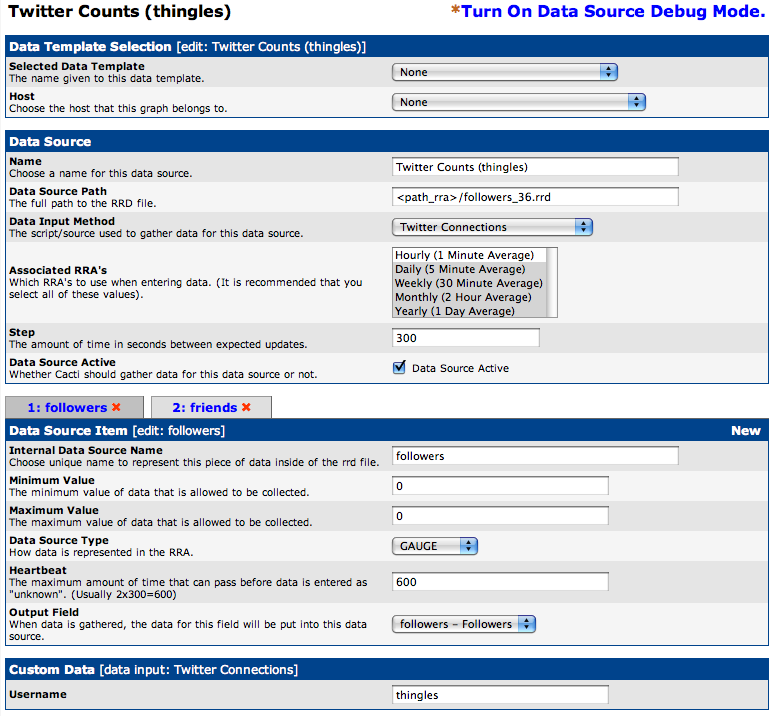
Here is the 2nd Data Source Item defined.
After all this we need to make the graph itself. Here is where it would be really nice for everyone else if I defined a graph template. However, I have no clue how to make a graph template so you’ll have to do it like I did, by hand. You can do this however you like, here is the most typical setup I use with 8 Graph Items.
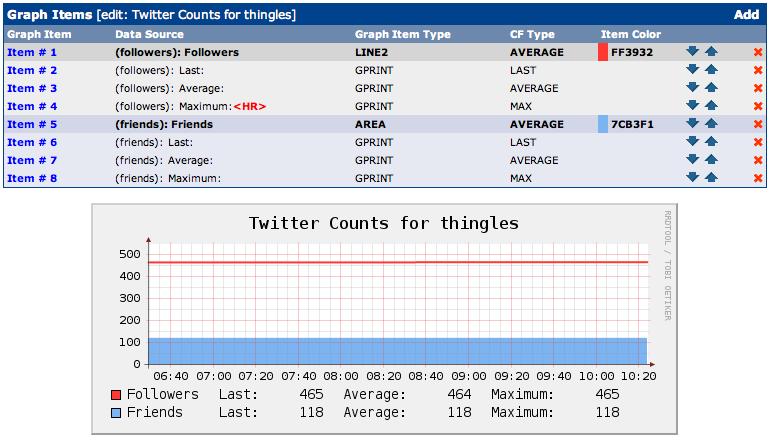
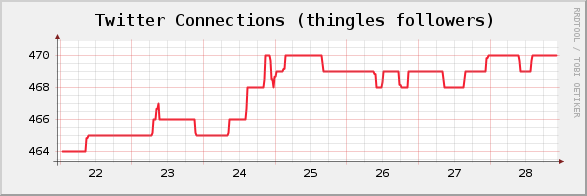
If your count of friends or followers is very high, and dissimilar, you may find it helpful to graph followers and friends on different graphs so you can see changes easier. This is what the first graph in this post shows that you cannot see if you put that same line on a graph with a bigger range for a Y-scale.