
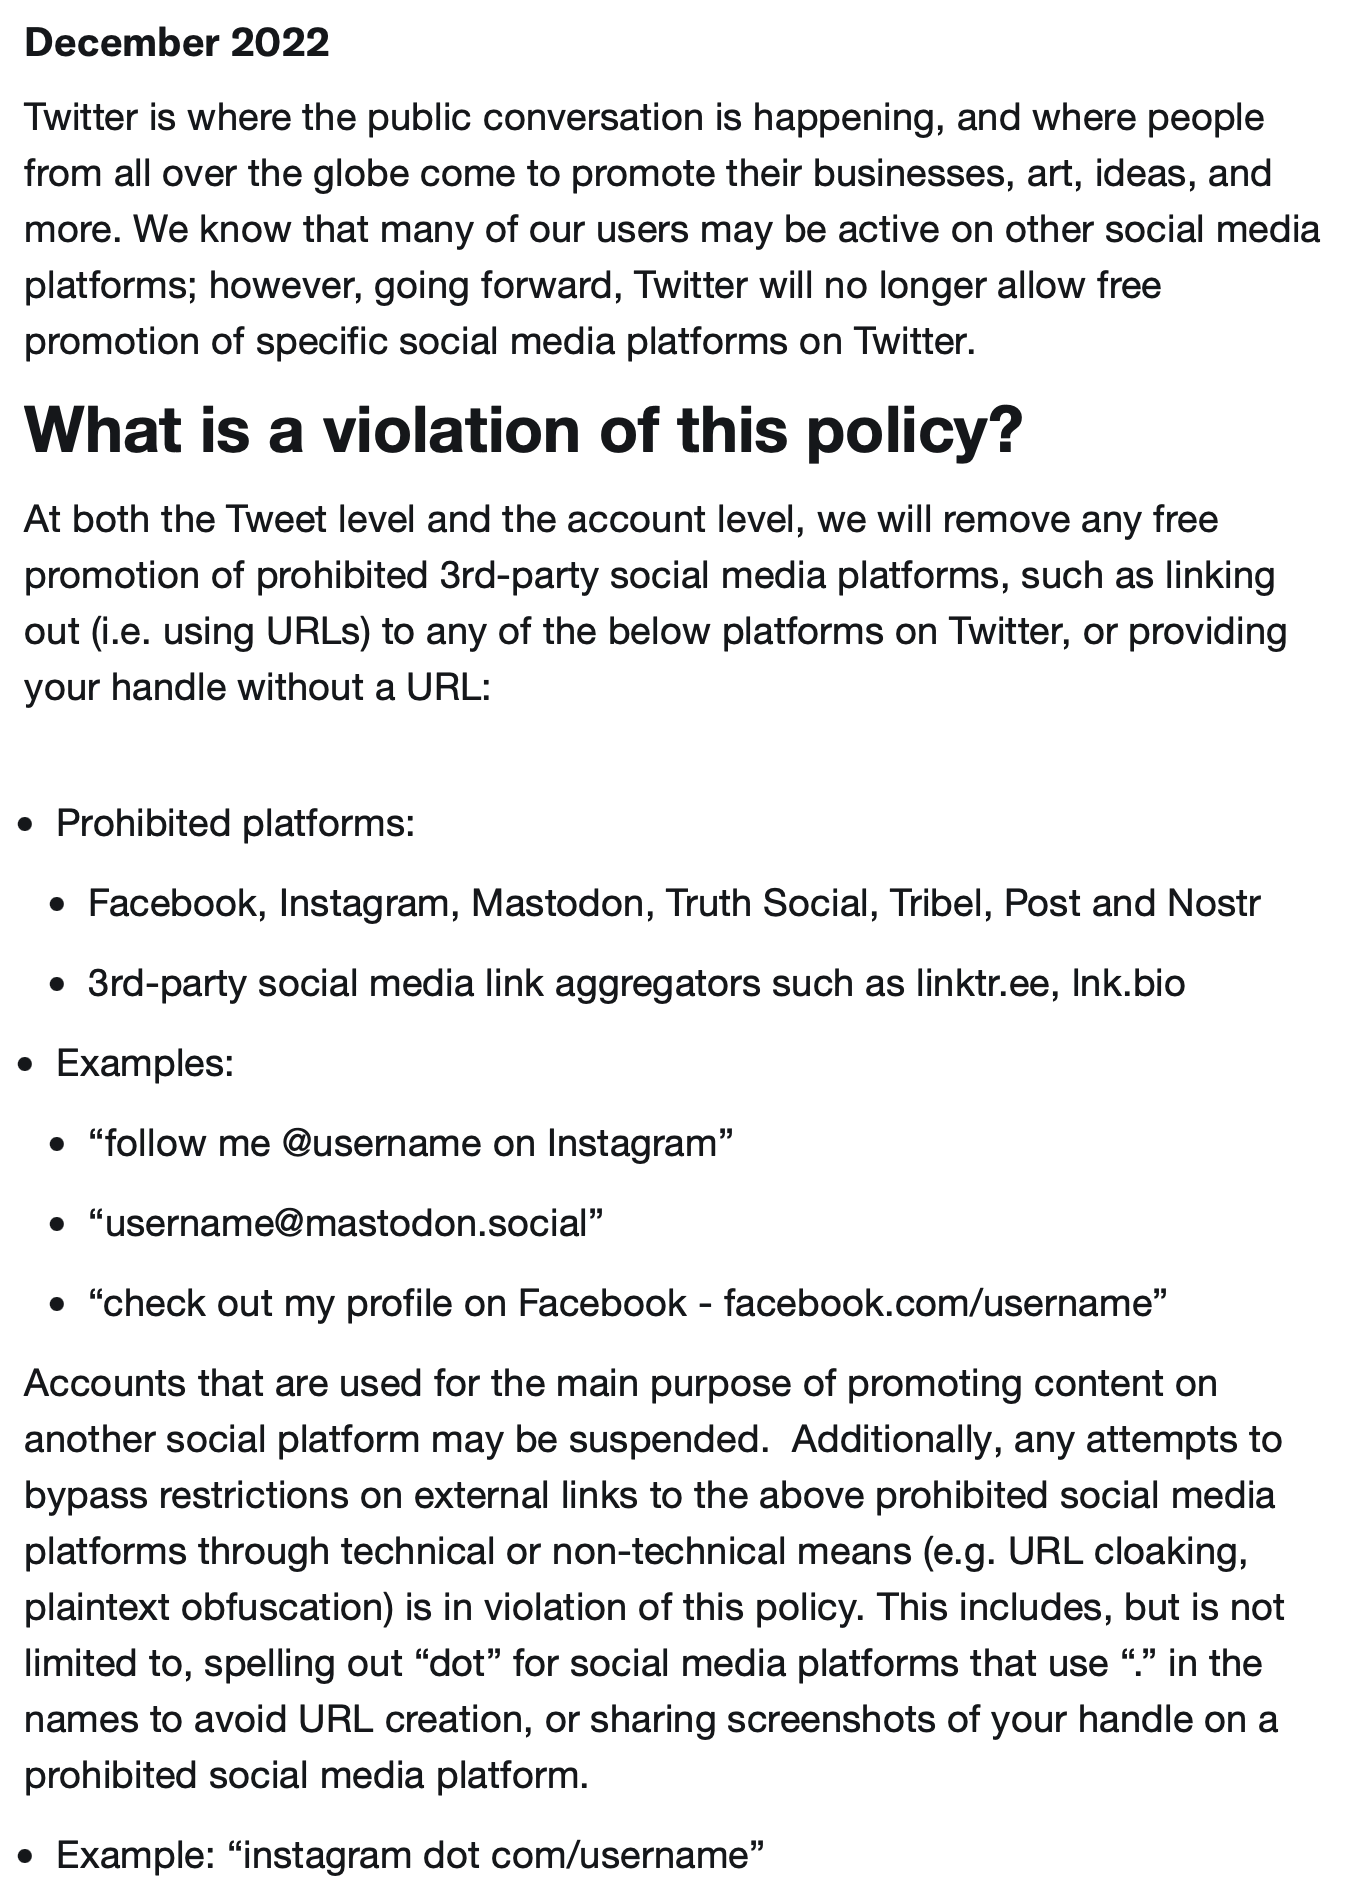
This new “Promotion of alternative social platforms policy” on Twitter deserves memorializing for the pure idiocy of it.
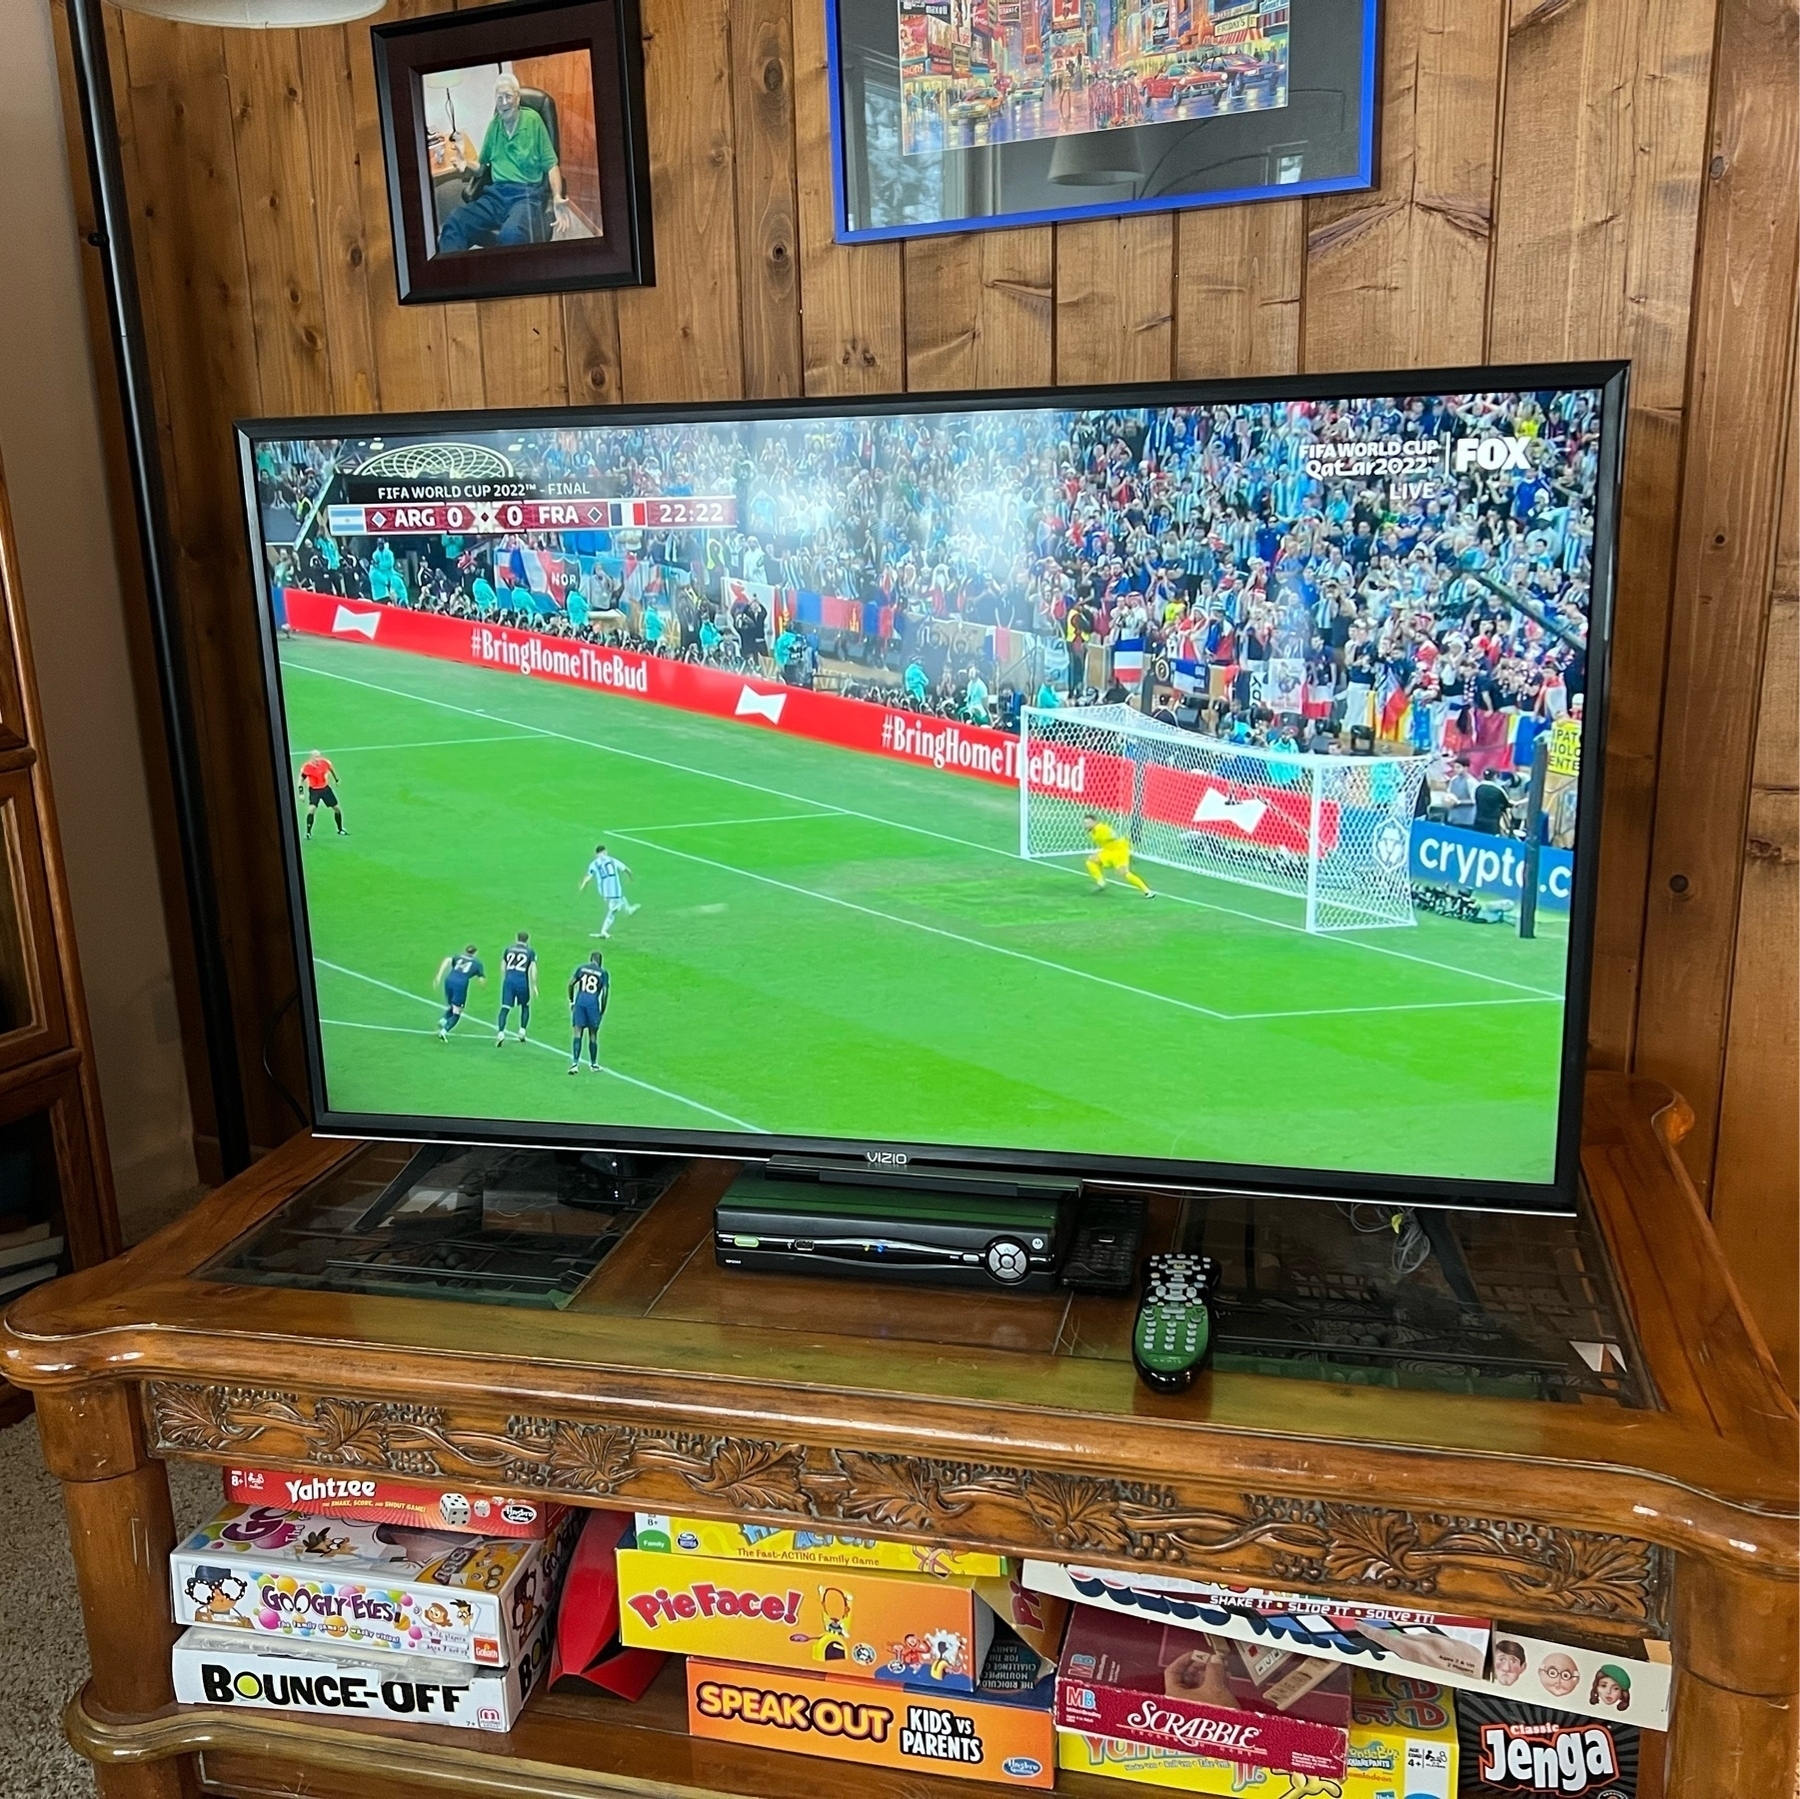
The goalkeeping from Martinez was epic for Argentina! 🇦🇷 ⚽️
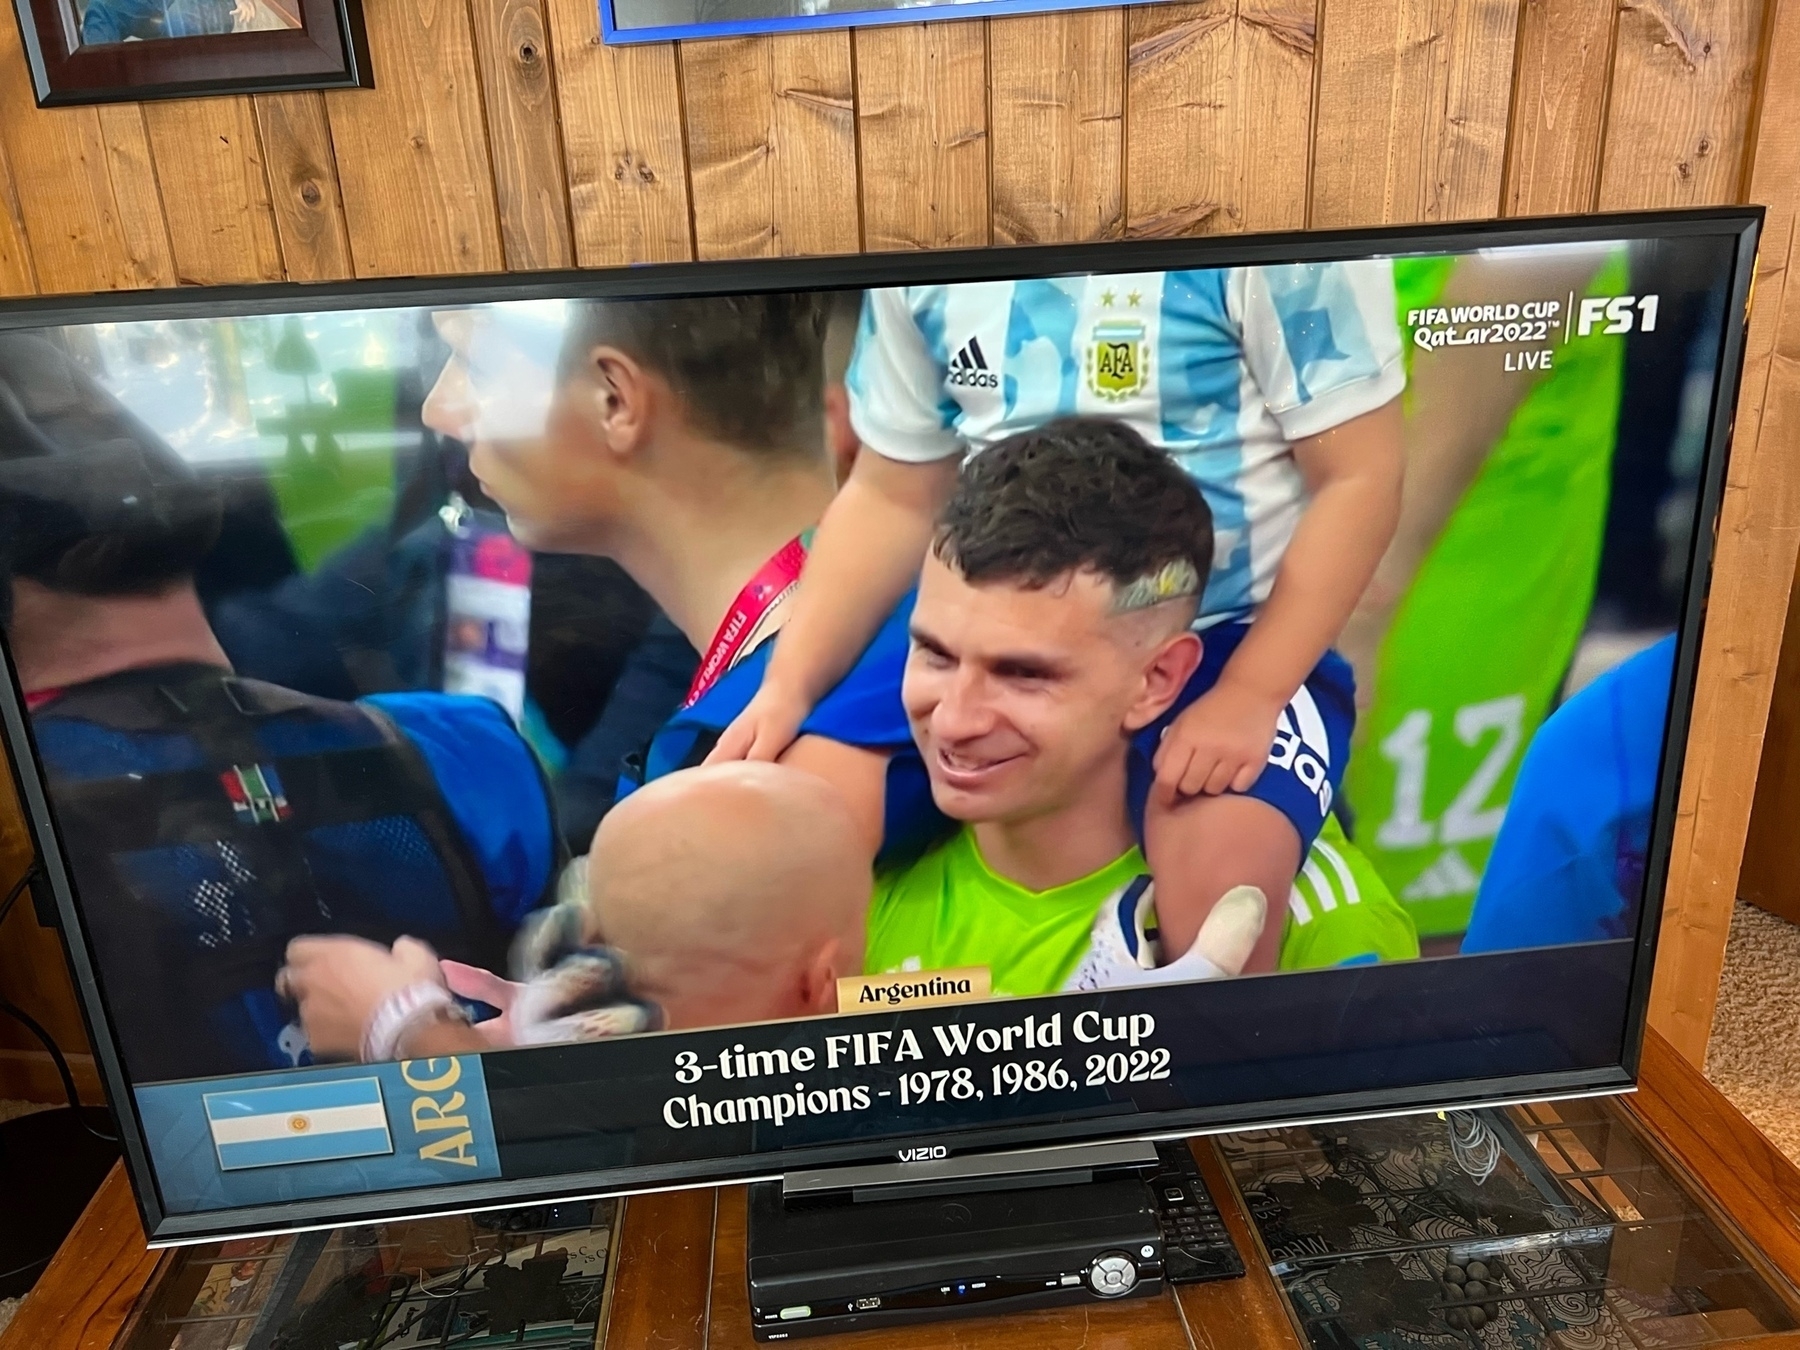
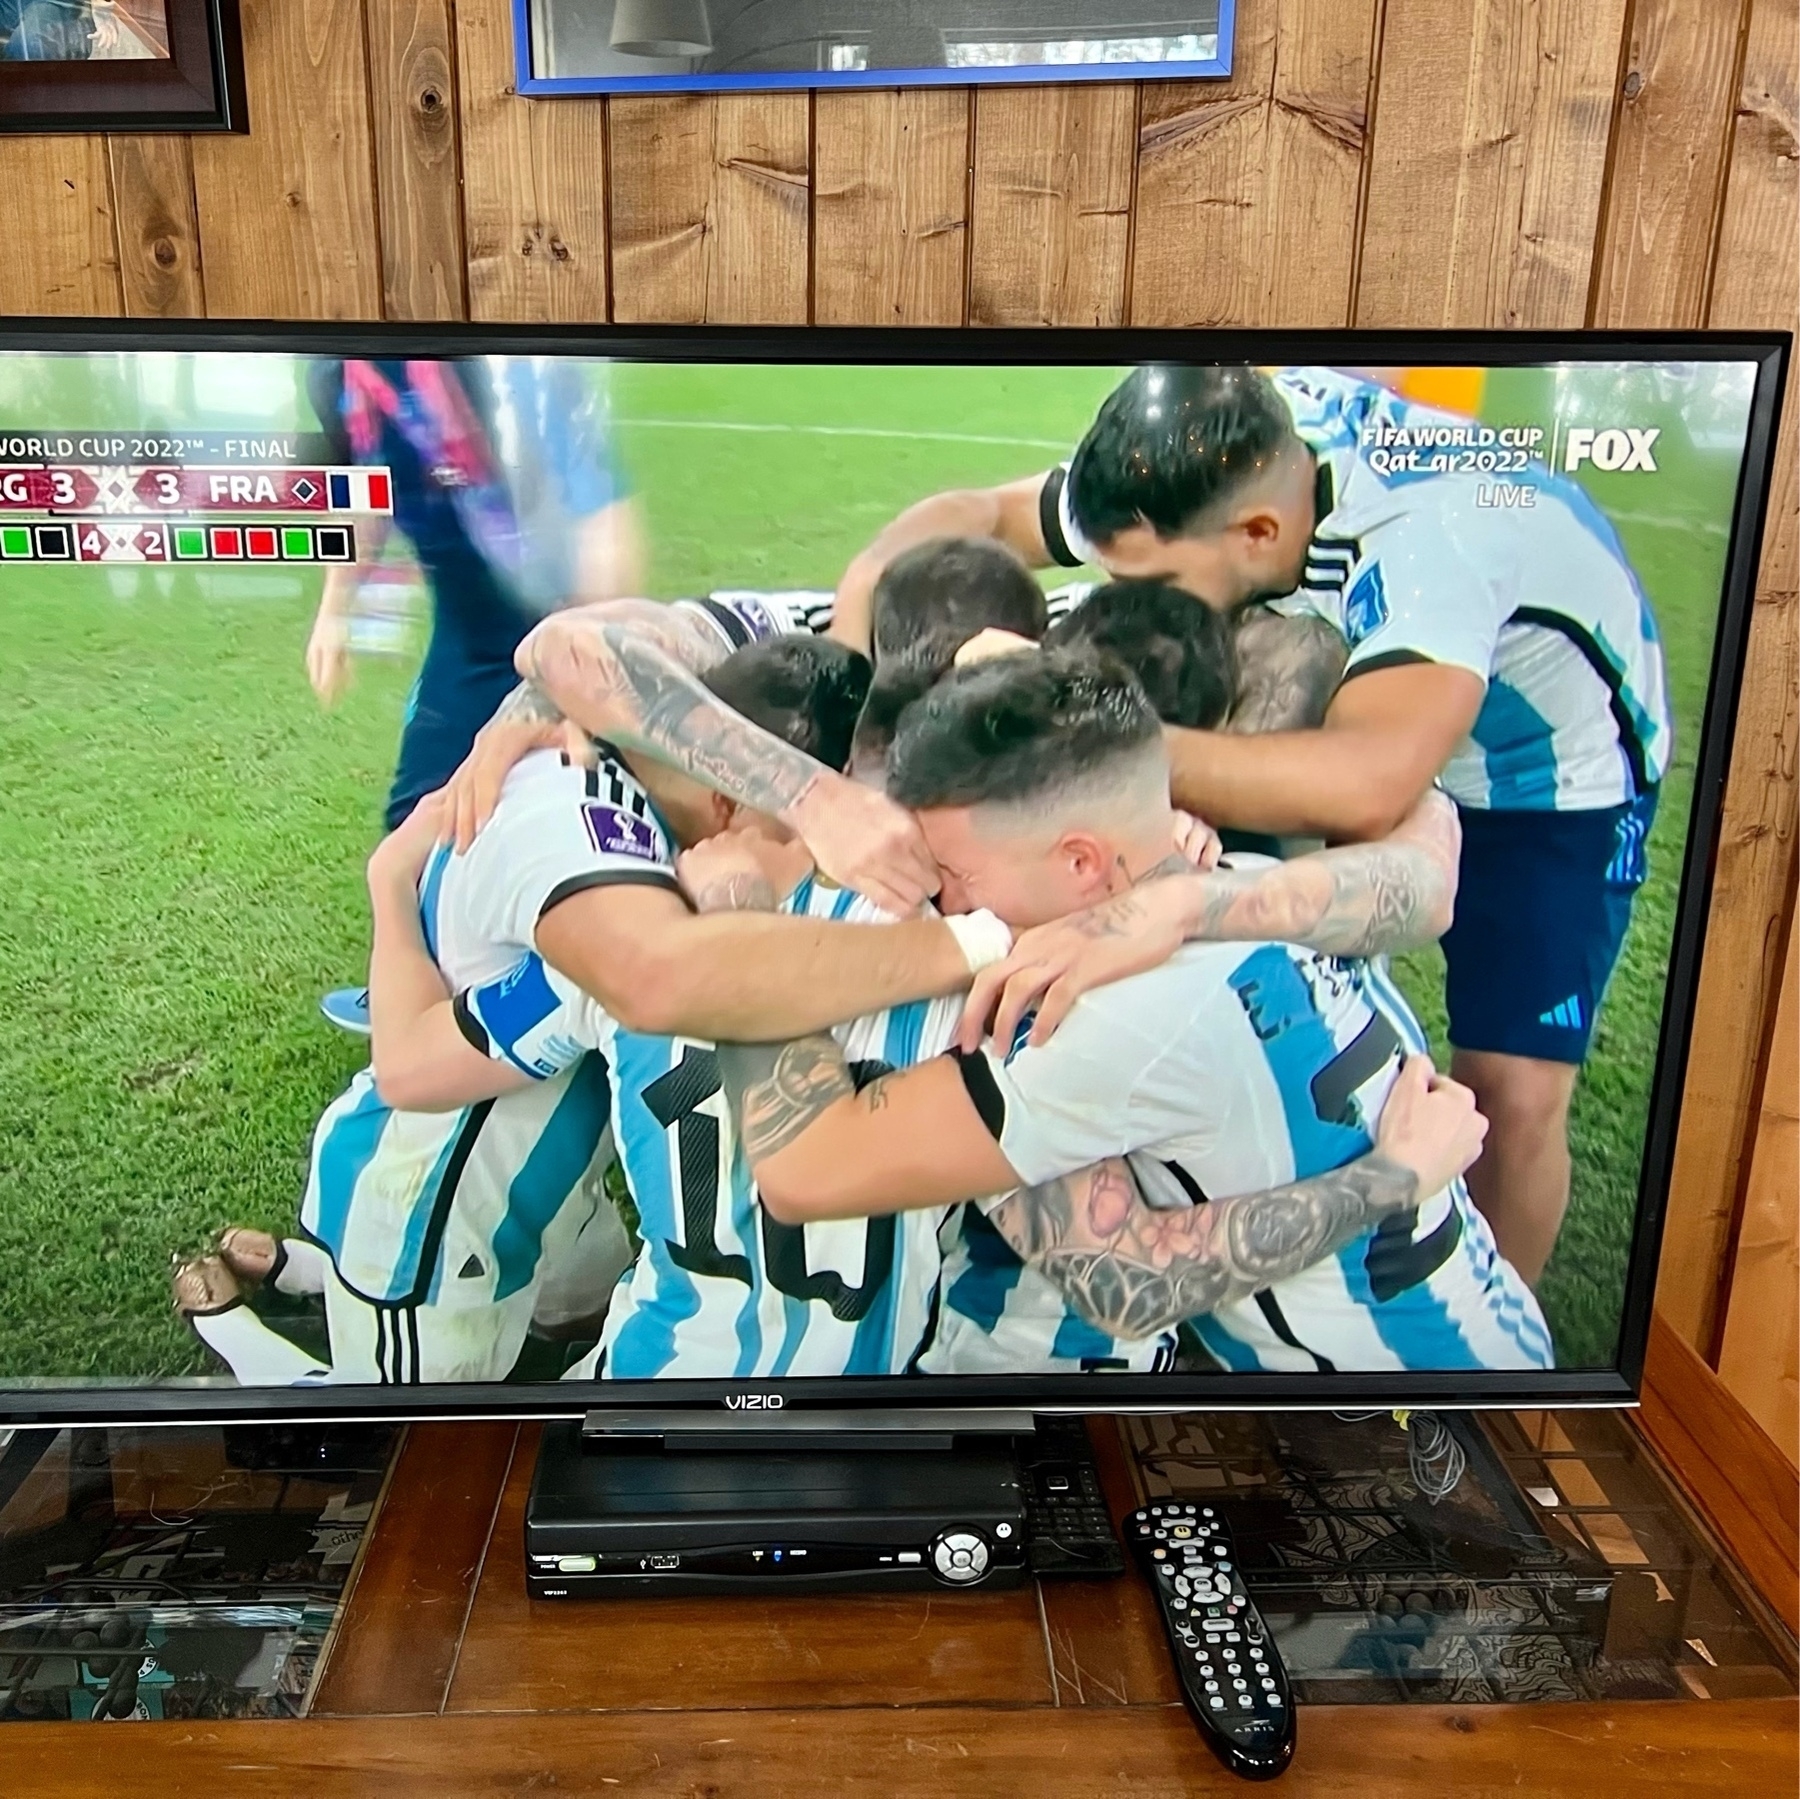
That was absolutely beautiful and epic. Tears or joy for Argentina. Messi the heart of it all. Mbappé gets golden boot. Love this game. Argentina 🇦🇷 3 v France 🇫🇷 3. 4-3 on kicks. ⚽️🎉
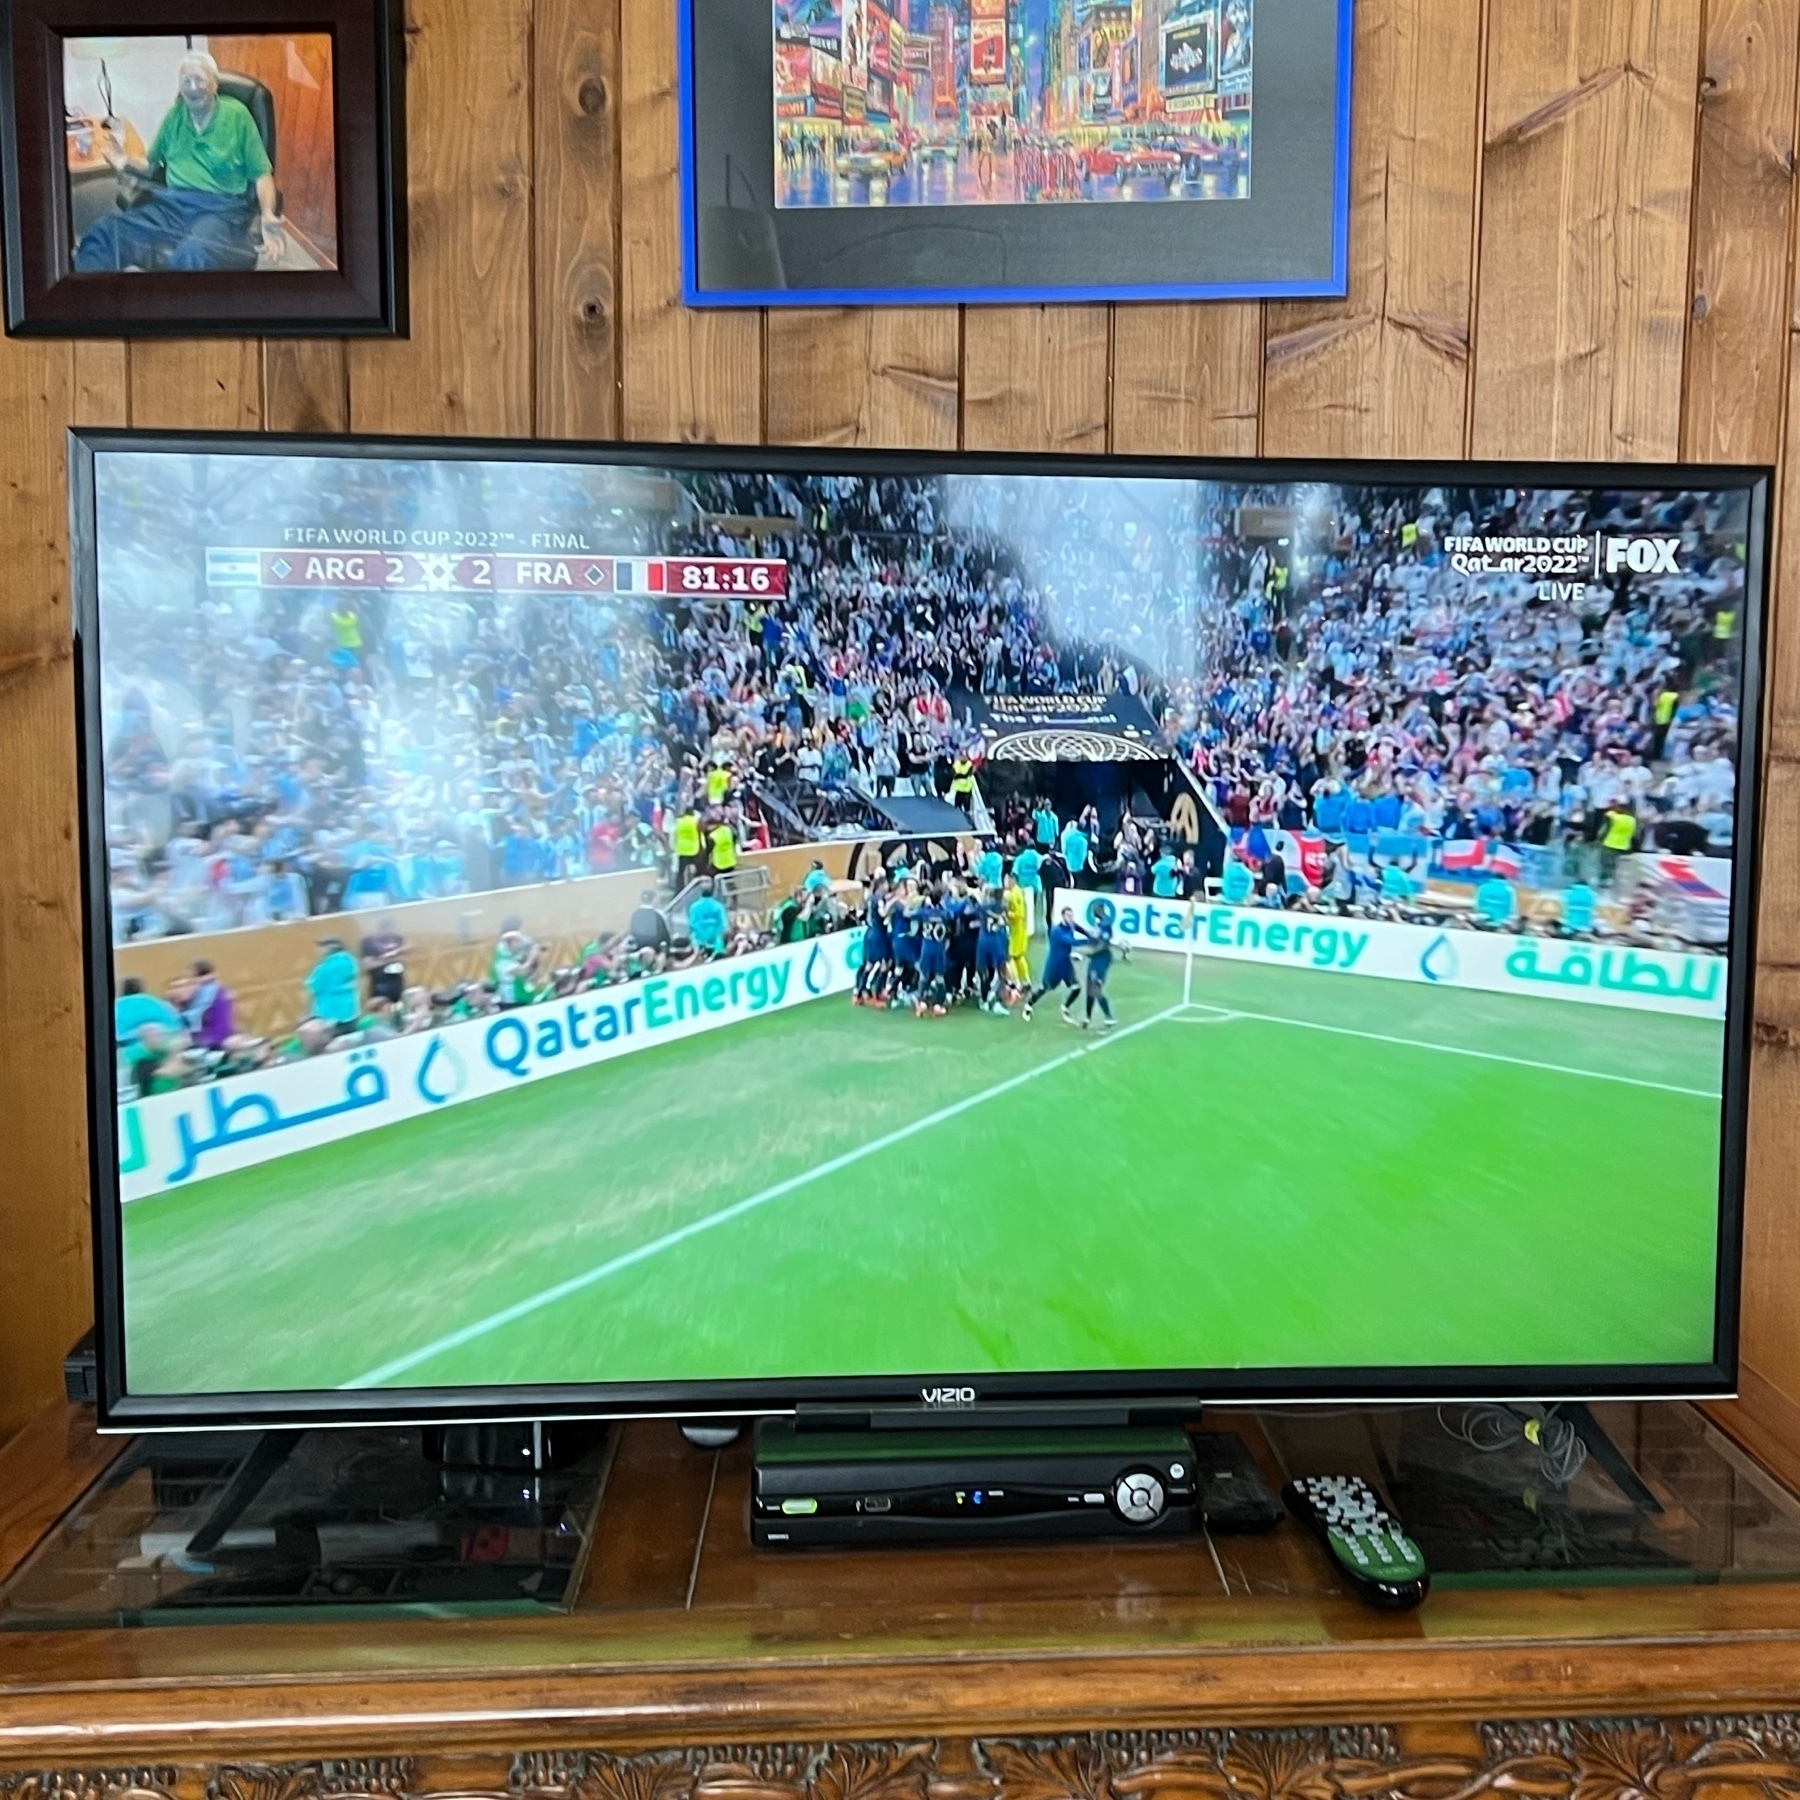
Suddenly penalty kick and another in the back of the net goes Argentina 2 France 2!!! ⚽️ 1m 33s between goals.
GOAL!!! Argentina 2 France 0.
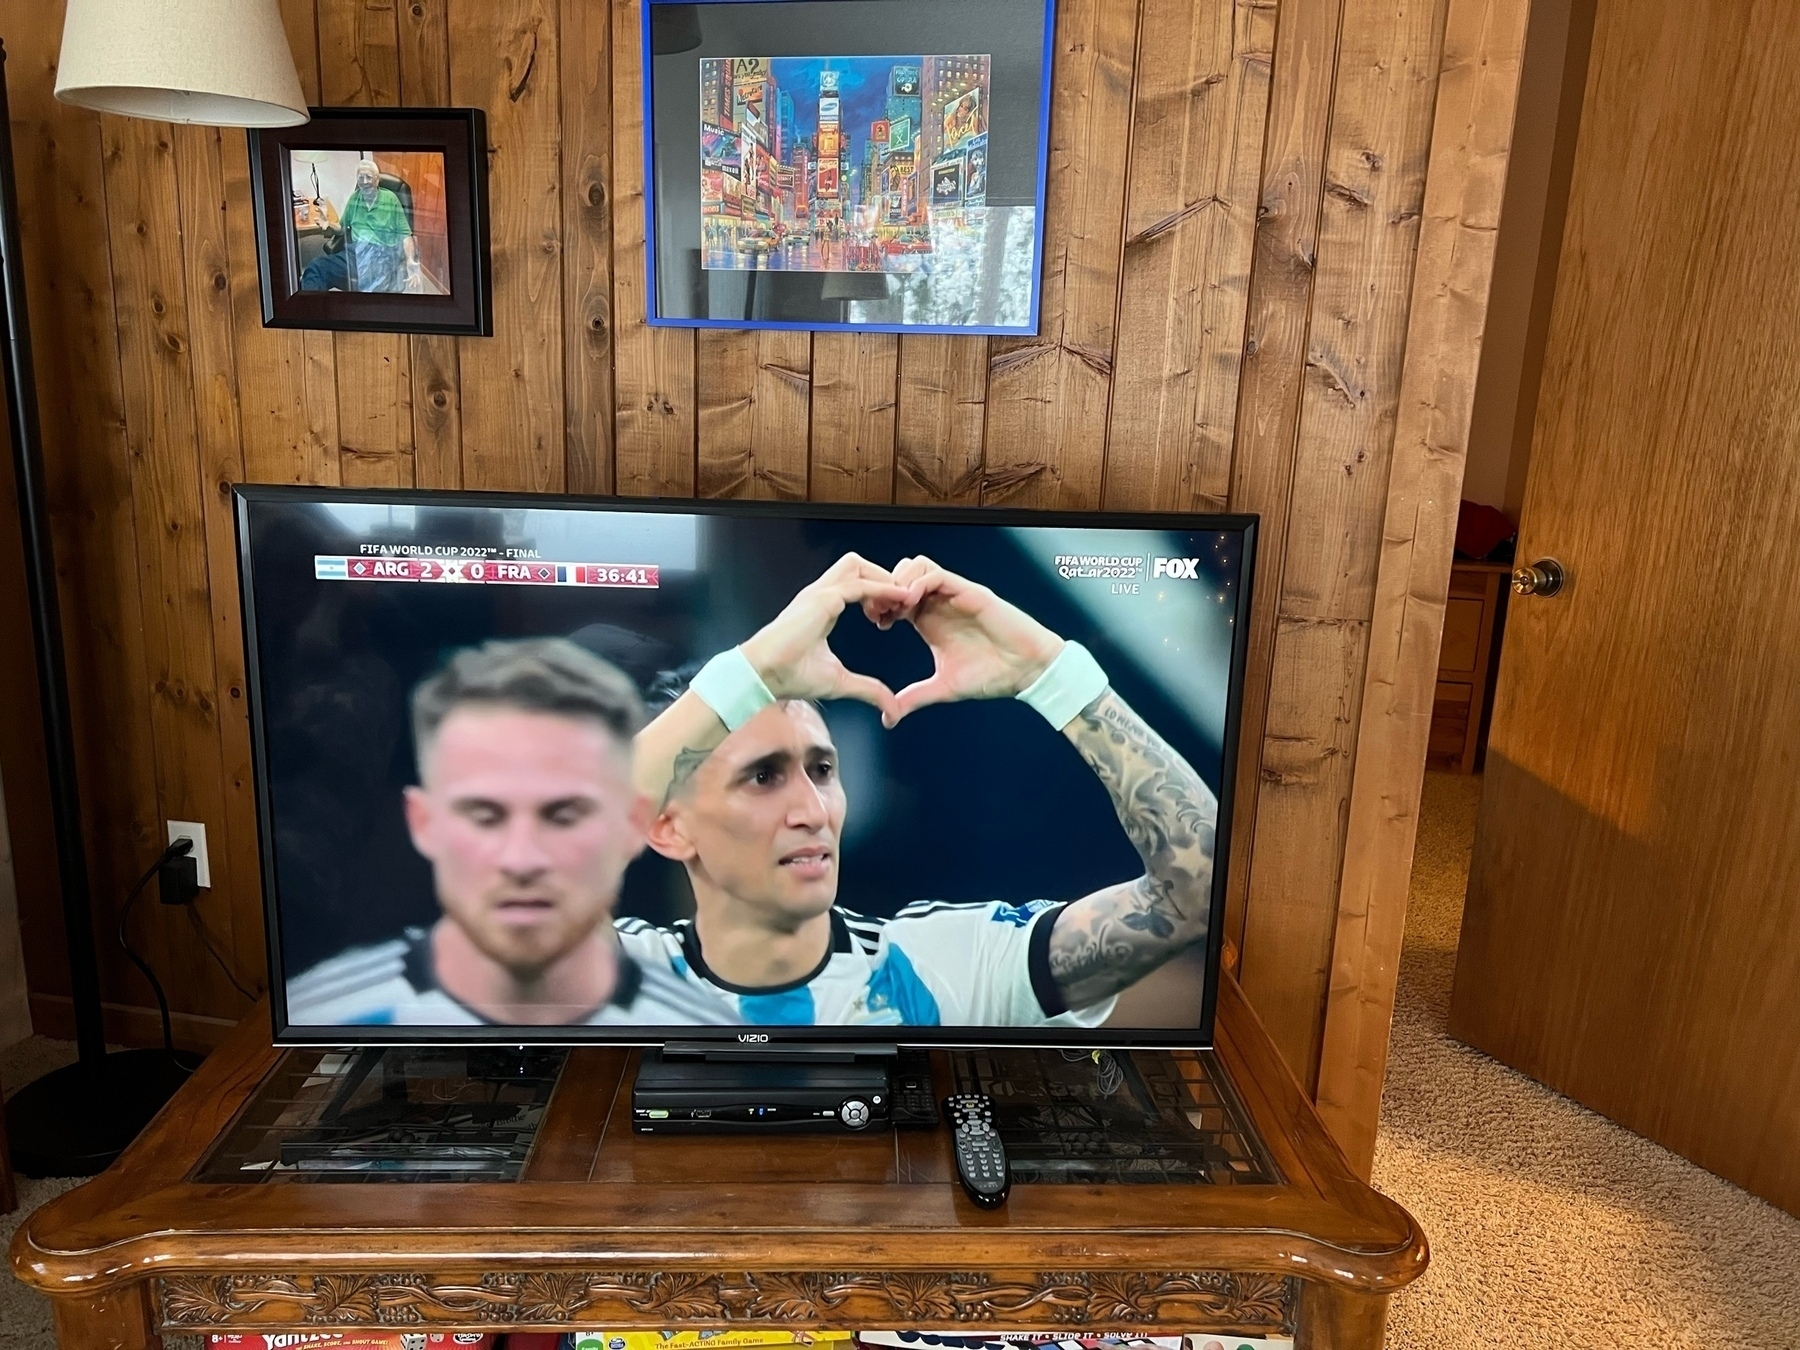
GOAL!!!! Argentina 1 France 0
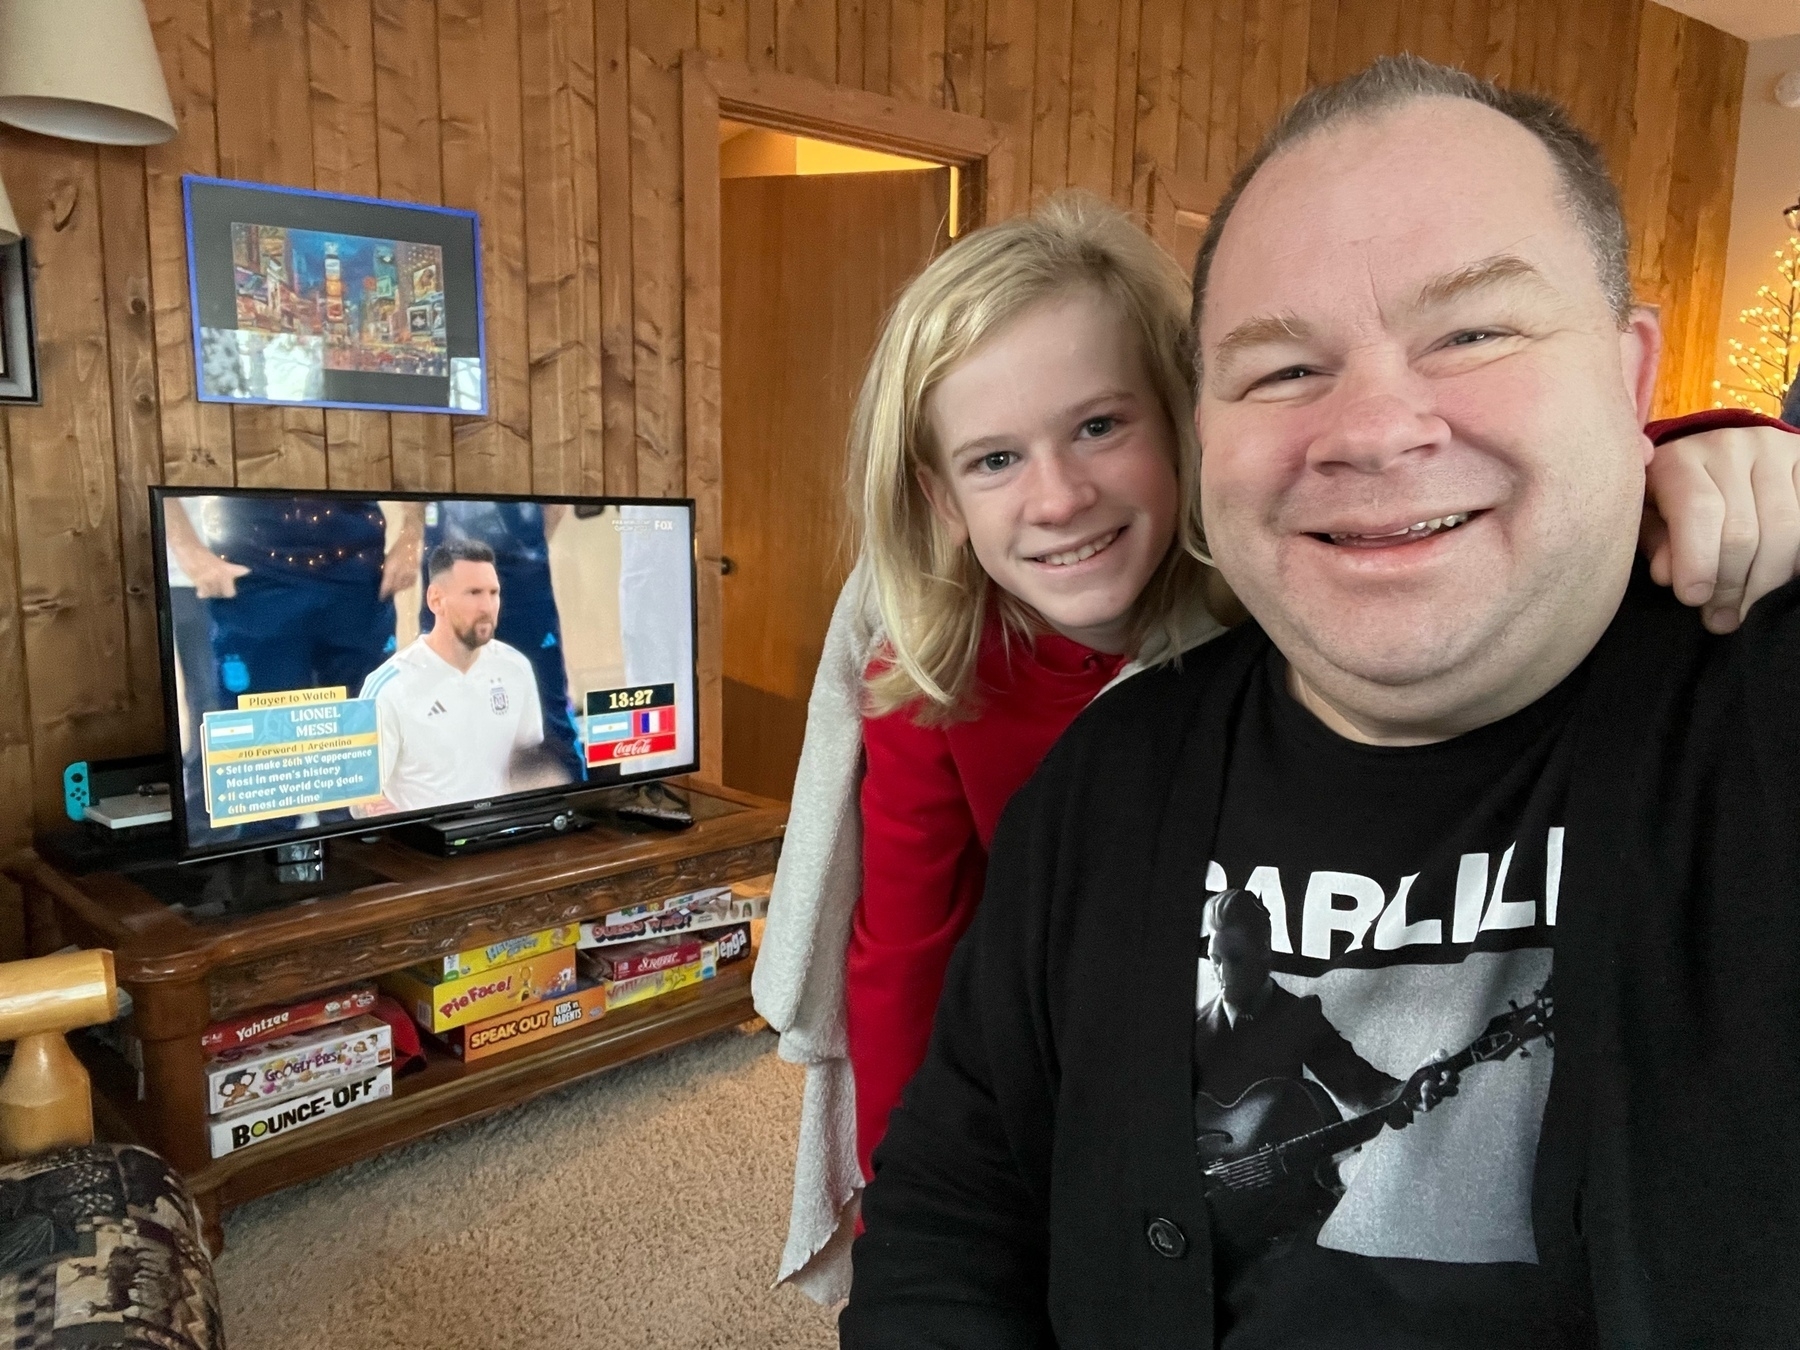
Getting ready for history to be made! Tyler and I got a selfie with Messi! Cheering for Argentina at my brothers place on Lake Pokegama! 🇦🇷⚽️🎉
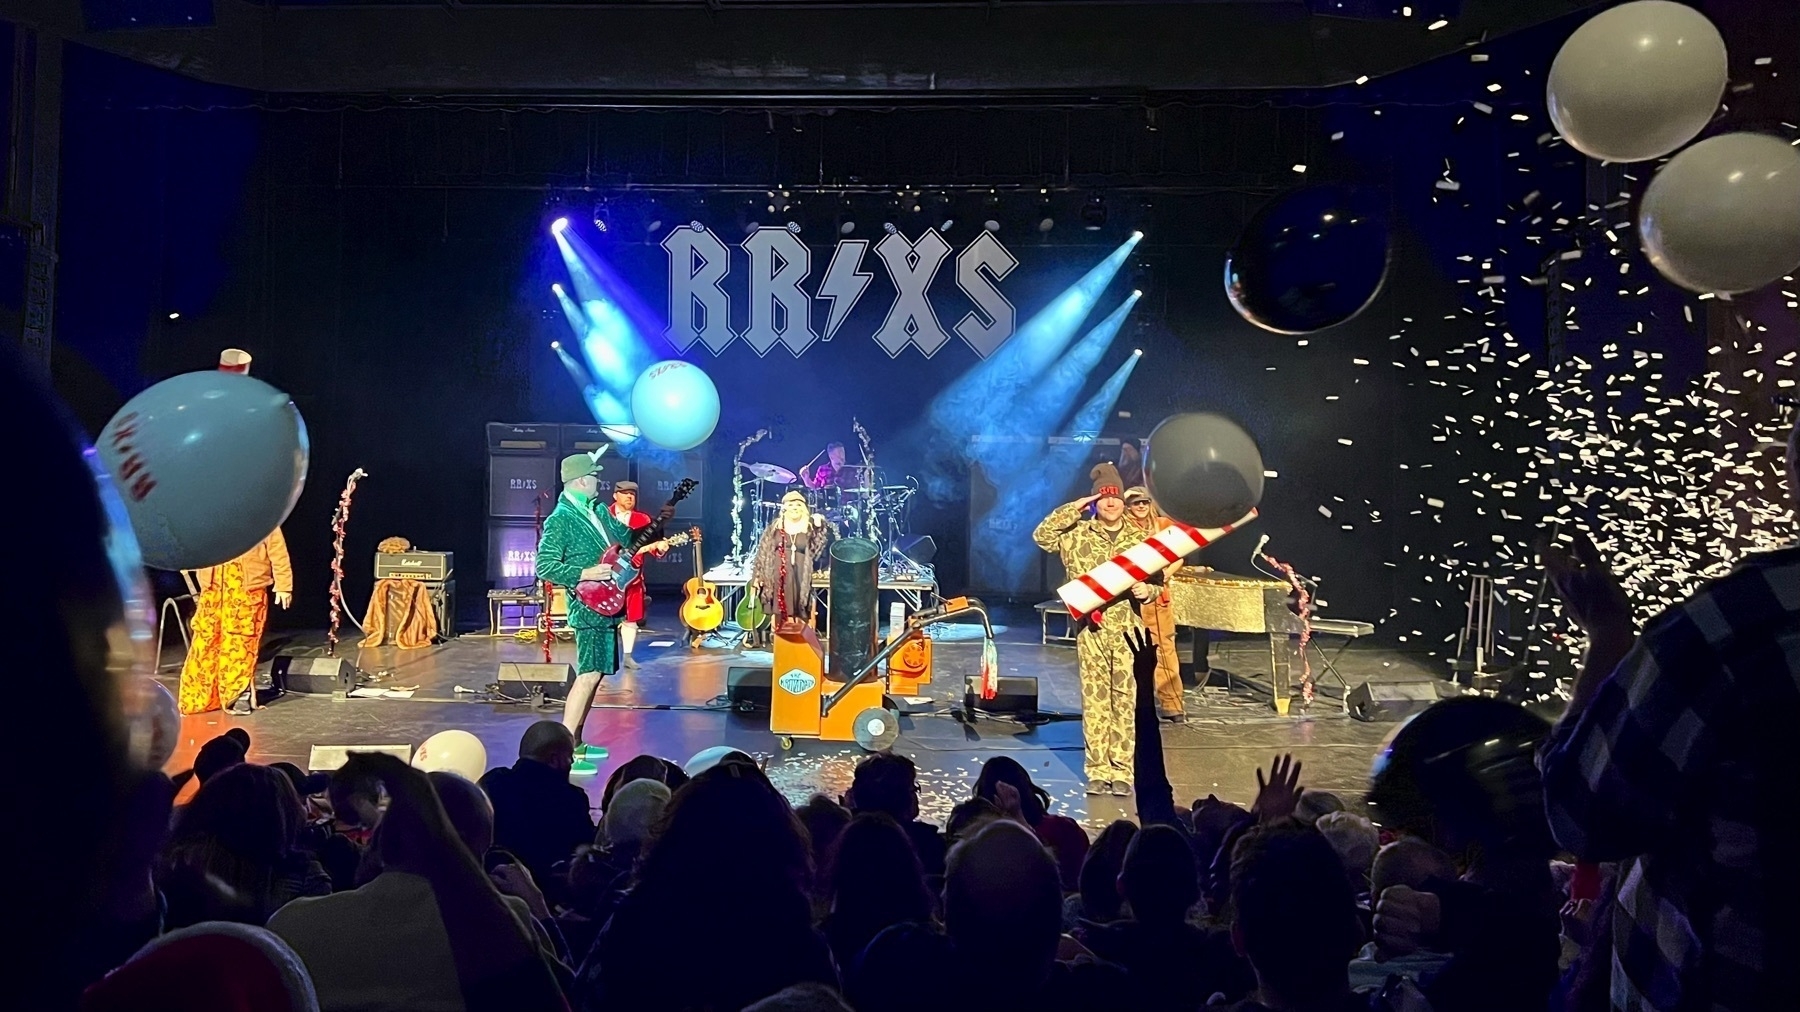
We had a great time at the Rock & Roll Christmas Show!
These tall pines are carrying a lot of weight. Lake Pokegama, MN.

Not your domain, not your words
In the crypto community there is a common and very important saying:
Not your keys, not your crypto.
Meaning if you don’t manage the private keys to your wallet, someone else is. And whoever that someone else is, they actually own your crypto. A lot of people are learning this lesson again with the fraud at FTX.
I think we need another saying for social media.
Not your domain, not your words.
If your writing is on some website where you don’t control the domain in the URL, then it isn’t your writing. Whoever controls that domain name, they can do whatever they wish. This lesson gets confused in hand wringing about censorship and freedom of speech.
If you want your words to be yours, get your own domain name, and put a website on it. There are several services that make this easy for a small fee.